
Who gets married and who doesn’t – evidence from the 2021 Census
Daniel Lilley, 10 May 2023

Summary
Proportion married
- Marriage is down – compared to 1991, adults in 2021 are 44 per cent more likely to have never been married.
Cohabitation
- Cohabiting is up – all ages below 85 years old have seen a rise in cohabiting. Couples living together aged 25-34 were 27 per cent more likely to be cohabiting in 2021 than they were in 2011.
Same-sex marriages
- 99.4 per cent of marriages in England and Wales are between opposite-sex couples, same-sex marriages make up 0.6 per cent of marriages.
Marriage and religion
- Christian, Jewish, Muslim, Hindu and Sikh individuals (five largest religions) are 24 per cent more likely to be married and 21 per cent less likely to be divorced than those who say they have no religion.
Marriage and ethnicity
- 27 per cent of Black Caribbeans and those of mixed ethnic group White and Black Caribbean are married. Conversely, 43.5 per cent of White British individuals and over 60 per cent of Pakistani, Indian and Bangladeshi individuals are married.
- Bangladeshis are 45 per cent more likely to married than those are White British and 71 per cent more likely to be married than those who are Black Caribbean.
Civil partnerships
- People in civil partnerships account for less than half of one per cent (0.45 per cent) of all marriages and civil partnerships.
Lone parenthood
- Lone parenthood is highest in London – Over 40 per cent of families with children in the London Boroughs of Southwark, Lambeth and Islington are lone parent families. In areas such as Guildford, St Albans and Wokingham, less than 17 per cent of families with children are lone parent families.
Rise in proportion of people never married
- 34.6 per cent of adults had never been never married in 2011, this jumped 3.3 per cent to 37.9 per cent in 2021.
- The population share of people who have experienced divorce grew by 2.8 per cent in the 20 years from 1991 to 2011. Between 2011 and 2021, divorce has increased by 0.1 per cent.
- In 2021, 46.9 per cent of individuals in England and Wales were married, down from 49.4 per cent in 2011.
- Men are less likely to get married young than women. In 2021, 63.8 per cent of 30- to 34-year-old men had never been married compared with 54.2 per cent of women the same age. In 1991, just 28.1 per cent of men aged 30-34 had never been married.
- The proportion of women over 75 who have never been married was 10.4 per cent in 1991 and was only 4.2 per cent in 2021 – much less than half. Part of this may be a significant rise in the marriage rate of over 65s in the last decade.
- This may be a lagged effect of the fact that the likelihood of divorce increased significantly for marriages between 1960 and 1990, such that an individual in their 80s in 2021 who got married in the 1970s is much more likely to have since got divorced than an individual who was in their 80s in 1991. It may also be an increase in the incidence of remarriage for widows, perhaps because of increased life expectancy.
- These things could mean that individuals who were never married by their 60s or 70s may be more likely to find a single individual to marry than they were in the recent past.
People in England and Wales, especially young adults, have become much less likely to be married
Figure 1.
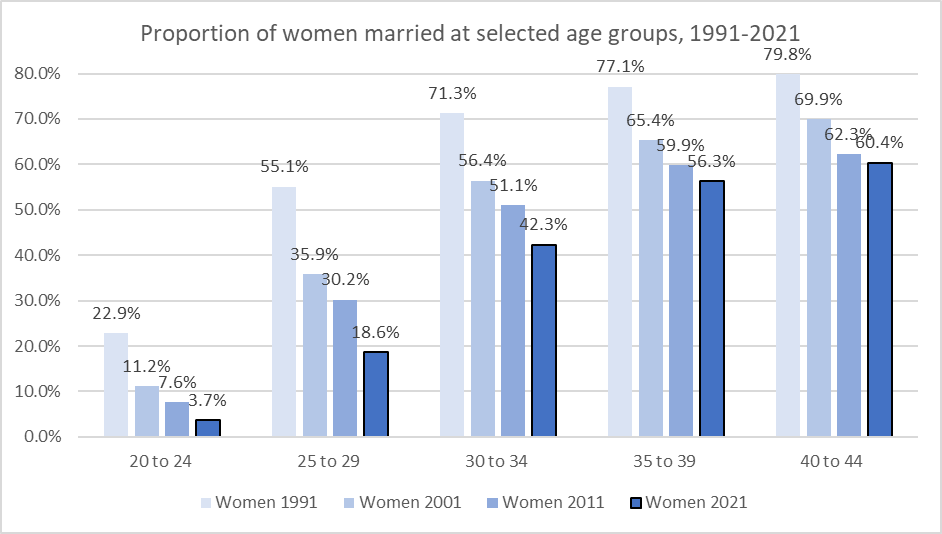
Figure 2.

- 31 per cent of 20-39-year-old women were married in 2021. In 1991, 56 per cent of 20–39-year-old women were married, almost twice (1.8 times) as many.
- 47 per cent of 20–39-year-old men were married in 1991, yet only 25 per cent of men were married in 2021. 20–39-year-old men were almost twice (1.9 times) as likely to be married in 1991 than in 2021.
- The percentage of people over 75 who are married has increased since 1991 for both men and women, although it is much higher for men as women have a longer life expectancy so are more likely to be widowed.
- In 2021, 53.4 per cent of men over 85 were married. This is the first time this has been over half.
- In 2021, 17.4 per cent of women over 85 were married.
Mixed picture of divorce
Figure 3.
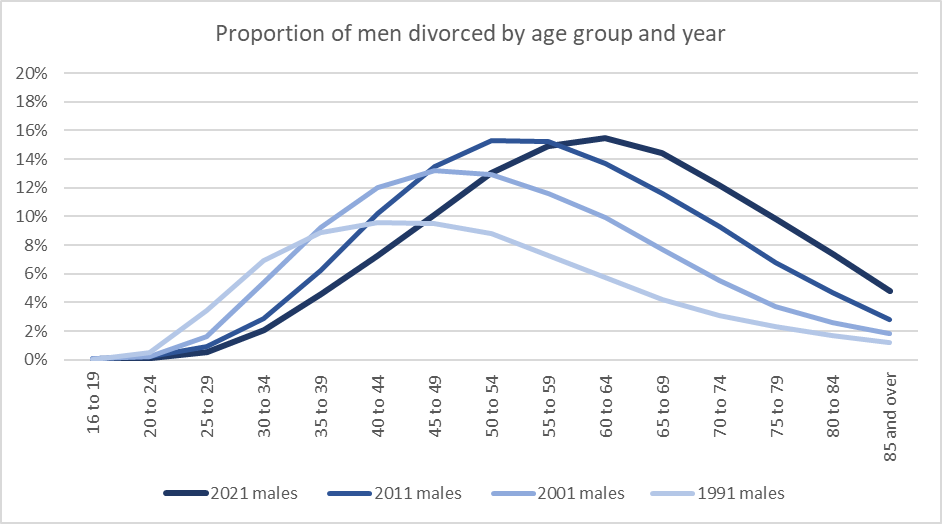
Figure 4.
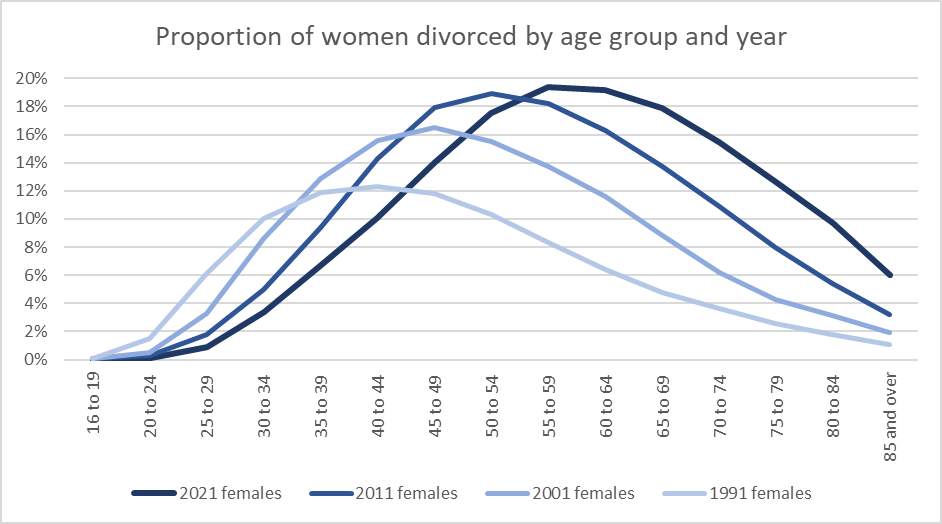
- The figures show that the cohort of divorced individuals was getting older from 1991 to 2021, divorce was most prevalent in those in their early forties in 1991, and is now most prevalent in those in their early sixties, this is because the divorce rate has been falling.
- For under 40s, divorce fell almost two thirds between 1991 and 2021.
- Divorce rates are affected by both marriage rates and likelihood of divorce for marriages. This makes it important to take care when looking at divorce rates.
- Both likelihood of divorce and the divorce rate have been falling since around 1995, but from at least 1963 (earliest data) to 1995 likelihood of divorce was increasing.
Over 55s
- Since 1991, the percentage of over 55s who have ever been divorced has been increasing every decade. This is most striking for those aged 65 to 69.
- In 1991, 4.2 per cent of men aged 65-69 and 4.8 per cent of women aged 65-69 had ever been divorced. In 2021, 14.4 per cent of men aged 65-69 and 17.9 per cent of women aged 65-69 had ever been divorced.
- This means that 65- to 69-year-old women were 3.7 times more likely to be divorced in 2021 than 1991. 65–69-year-old men were 3.4 times more likely to be divorced in 2021 than 1991.
Aged 40-55
- For men and women aged 40 to 55, divorce was rising from 1991 to 2011, but falling from 2011 to 2021..
- The percentage of 45–49-year-old women who had ever been divorced in 1991 was 11.8 per cent. By 2011, the percentage of 45-49-year-old women who had ever been divorced was up to 17.9 per cent. In 2021, the percentage of 45–49-year-old women who had ever been divorced was 14.0 per cent.
- The percentage of 50–54-year-old men who had ever been divorced in 1991 was 8.8 per cent. By 2011, the percentage of 50–54-year-old men who had ever been divorced was up to 15.3 per cent. In 2021, the percentage of 50–54-year-old men who had ever been divorced was 13.0 per cent.
Under 40s
- For those aged under 40, the proportion of men and women who have ever been divorced has been consistently falling since 1991.
- In 1991, 6.1 per cent of 25–29-year-old women had ever been divorced. In 2021, 0.9 per cent of 25–29-year-old women had ever been divorced.
- This is a fall from one in 16 to one in 111.
- In 1991, 10.0 per cent of 30–34-year-old women had ever been divorced. In 2021, 3.4 per cent of 30–34-year-old women had ever been divorced.
- This is a fall from one in 10 to one in 29.
- In 1991, 6.1 per cent of 25–29-year-old women had ever been divorced. In 2021, 0.9 per cent of 25–29-year-old women had ever been divorced.
Rise of cohabitation
Figure 5.
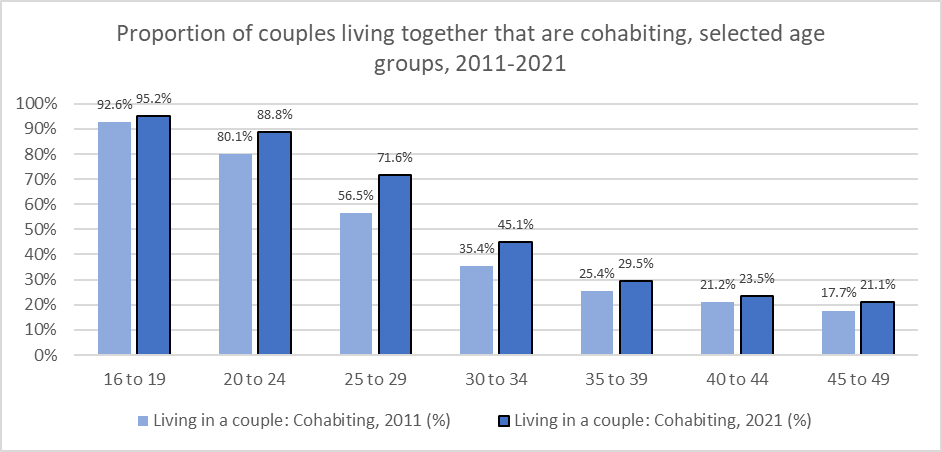
- Cohabiting rose for all age groups between 16 and 84, but it is most striking for those under 50.
- Couples aged 25 to 34 were 27 per cent more likely to be cohabiting in 2021 than they were in 2011.
- For those aged 25-29, in 2021, 71.6 per cent of couples living together were cohabiting. In 2011, 56.5 per cent of couples living together were cohabiting. A rise of 27 per cent.
- For those aged 30-34, in 2021, 45.1 per cent of couples living together were cohabiting. In 2011, 35.4 per cent of couples living together were cohabiting. Also a rise of 27 per cent.
- The prevalence of cohabiting varies geographically. The proportion cohabiting in Bolsover, the authority with the highest proportion of cohabiting among couples living together, is well over three times that of Harrow.
- Young couples are far more likely to cohabit than older couples – the proportion cohabiting thirteen times higher for those aged 20-24 than those aged 70-74. This means, geographically, older areas will have lower cohabitation rates.
- Also, cohabitation rates vary with prevalence of religious groups in geographical areas as cohabitation is more popular among those with no religion.
Table 1. Top 10
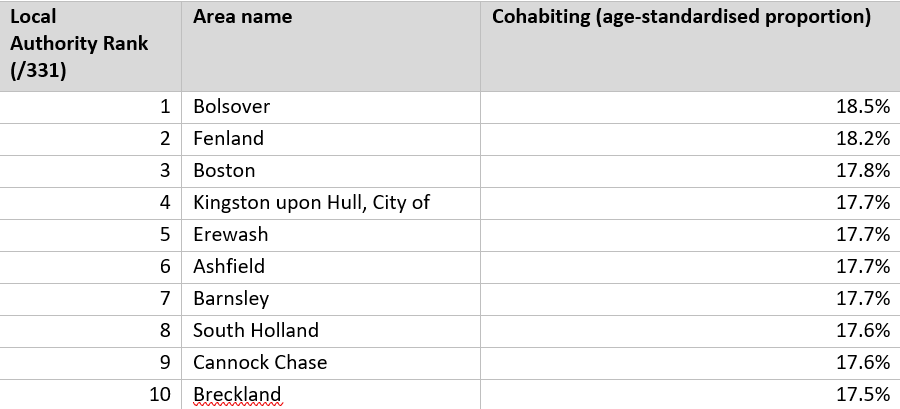
Table 2. Bottom 10

Same-sex marriages are very uncommon, as are civil partnerships
- There are 134,000 individuals who are in a same-sex marriage in England and Wales, this is made up of 65,700 men and 68,500 women. Same sex marriages account for 0.6 per cent of marriages and 0.23 per cent of the population.
- There are only 103,000 people in England and Wales in a civil partnership, around 0.2 per cent of the population and 0.45 per cent of all marriages and civil partnerships.
- There are 10.75 million men and 10.70 million women in opposite-sex marriages in England and Wales (there are roughly 53,000 more men married to women who are not from England and Wales than there are women who are married to men who are not from England and Wales).
- The striking lack of same-sex marriage is explained by two reasons:
- Same-sex marriage only became legal on the 13March 2014,
- Only approximately three per cent of marriages each year are same-sex couples.[2]
- Those who had formed civil partnerships, including those before this 13 March 2014, are able to convert their civil partnership into a marriage.
Marriage, divorce, and religion
- Individuals who belong to one of the five major faith groups (Christianity, Judaism, Islam, Hinduism, Sikhism) are 24 per cent more likely to be married and 21 per cent less likely to be divorced than those who say they have no religion.
- 37.4 per cent of the population identify as having no religion, this group, however, only accounts for a little over a quarter (27.4 per cent) of married individuals.[3]
- 67.1 per cent of married individuals are religious (Buddhist, Christian, Hindu, Jewish, Muslim or Sikh), these groups accounts for 56.1 per cent of the population.[4]
- Christians now account for less than half of the population (46.2 per cent), but Christians do account for well over half of the married population (55.5 per cent).
- Compared to all married couples, same-sex couples are much more likely to be Buddhist or no religion, and much less likely to be Sikh, Muslim or Hindu.
- Over half (50.7 per cent) have no religion.
- Those who are Sikh, Muslim or Hindu make up 10.5 per cent of all those who are married or in a civil partnership, but only 3.9 per cent of those who are same-sex married or in a civil partnership.
- Conversely, those who are Buddhist make up 0.5 per cent of those who are married, but 1.3 per cent of those who are same-sex married.
- Hindus are over 62 per cent more likely to be married than those of no religion, Sikhs are 54 per cent more likely to be married than those of no religion.
- Religious individuals are less likely to be divorced, with the exception of those who answered ‘other religion’ (in this group, people were most commonly ‘Pagan’ or ‘Agnostic’).
Marriage, divorce, and ethnicity
Figure 6.
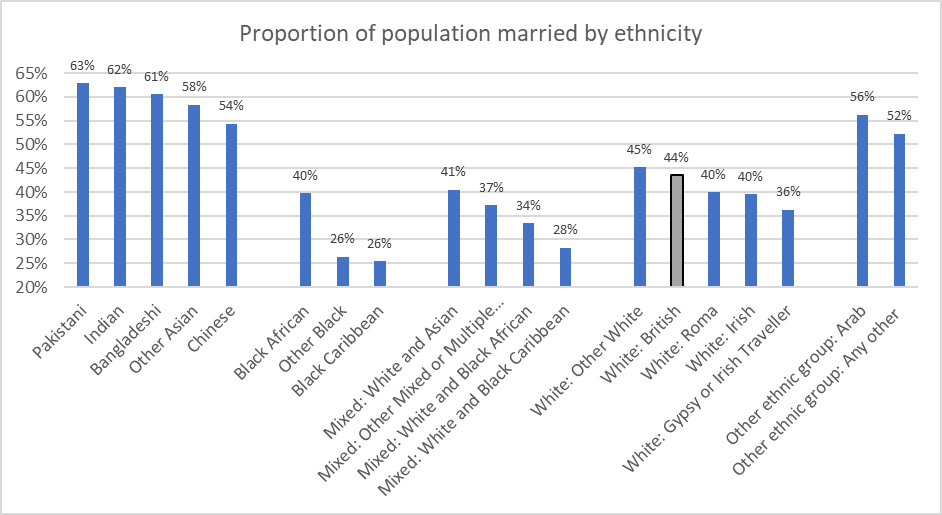
- The 2021 census separates the population of England and Wales into 19 ethnicities, each in one of five categories of ethnicity. Marriage rates vary significantly both across and within ethnicity categories. Over the last few decades, England and Wales has become far more ethnically diverse, however it remains mostly White British.[5]
- 27 per cent of Black Caribbeans and those of mixed ethnic group White and Black Caribbean are married. This is compared with 43.5 per cent of White British individuals and over 60 per cent of Pakistani, Indian and Bangladeshi individuals.
- Just under three quarters (74.4 per cent) or the population in England and Wales identified as White British, down from just over four fifths in 2011 (80.5 per cent) and from seven eighths (87.5 per cent) in 2001.
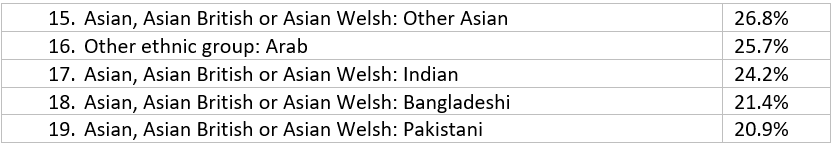
Proportion Never Married (White British was 9th with 38.7%)
Table 3. Top five
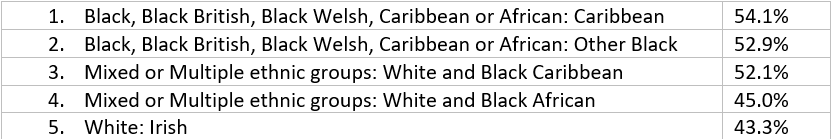
Table 4. Bottom five
Lone Parenthood Geographically
- Lone parent families with children are most prevalent in urban areas, especially London. Also, cities such as Middlesborough, Blackpool, Liverpool and Birmingham.
- For example, over 40 per cent of families with children in Southwark, Lambeth and Islington are lone parent families. In areas such as Guildford, St Albans and Wokingham, less than 17 per cent of families with children are lone parent families.
- A family with children in Southwark is almost three (2.8) times more likely to be a lone parent family than a family with children in Wokingham.
- The prevalence of lone parenthood in a particular region is a product of two things:
the prevalence of dependent children and the proportion of dependent children families that are lone parent families.
- This means that although some local authorities in London such as Southwark, Lambeth, Hackney and Islington have few lone parent families with children, they have the highest proportion of lone parenthood, of families with dependent children.
- For example, of the 331 local authorities, Islington has the 58th highest prevalence of lone parent families with dependent children, but the third highest prevalence of lone parent families with dependent children as a percentage of families with dependent children. This is because there are relatively few dependent children in Islington.
Table 7. Top 10
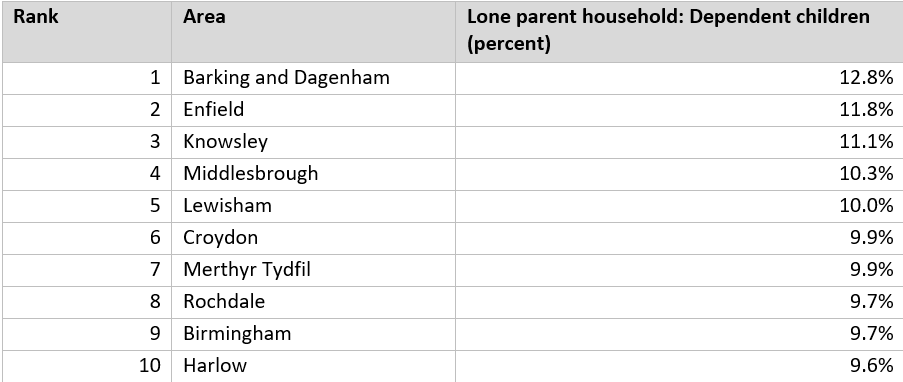
Table 8. Bottom 10
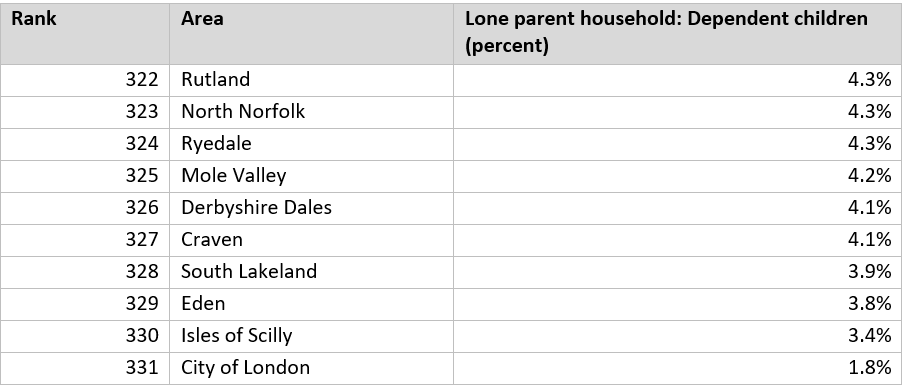
Table 9. Top 10
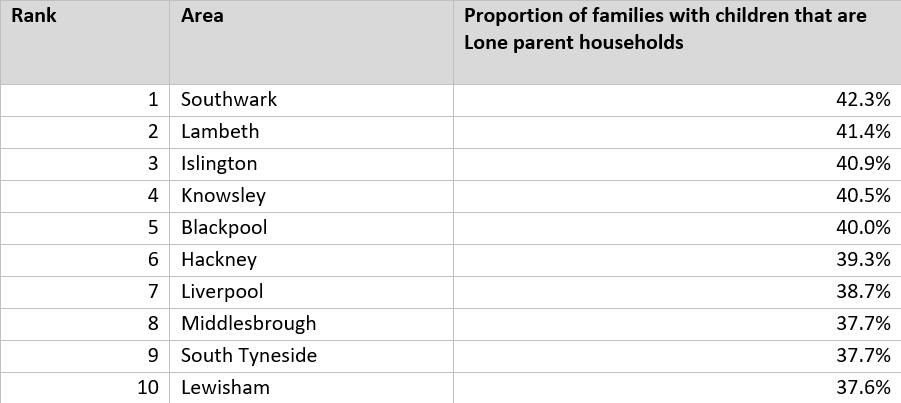
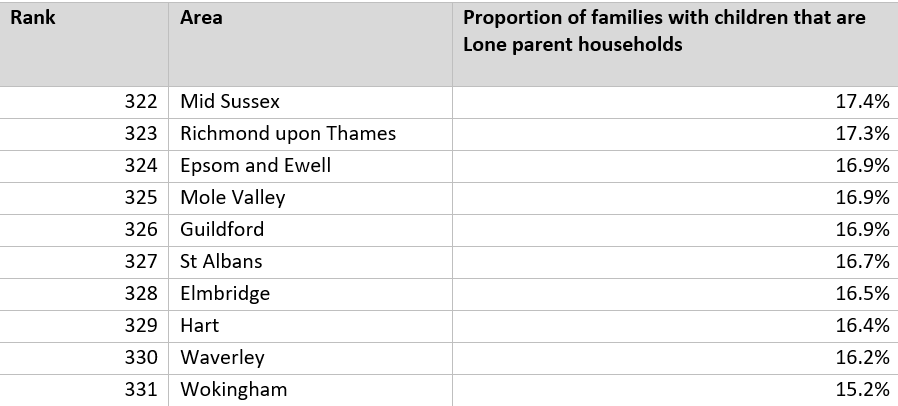
Table 10. Bottom 10
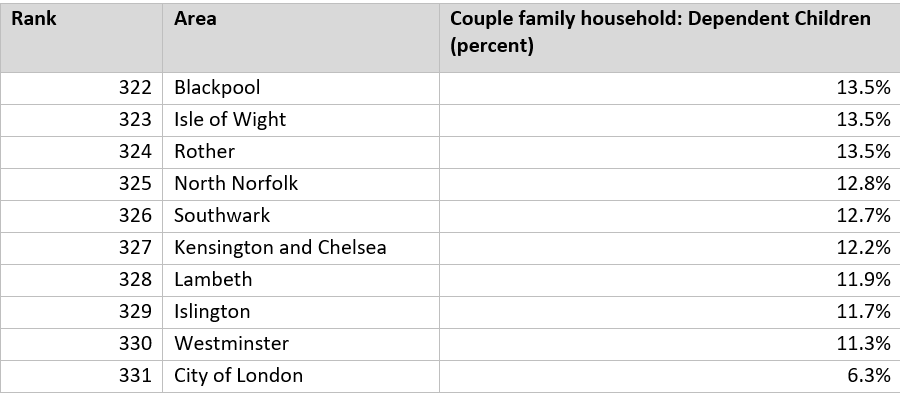
The table below provides context for the lone parent families result – it shows the areas with the greatest and fewest couple families with children.
Table 11. Top 10
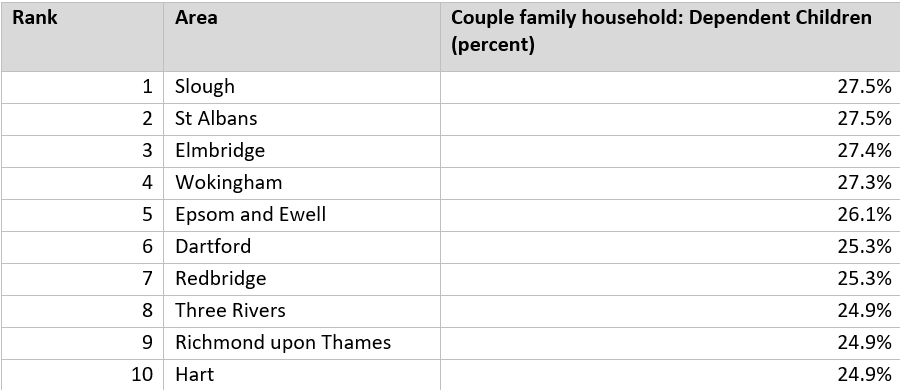
Table 12. Bottom 10
[1] Marriage and civil partnership status in England and Wales – Office for National Statistics (ons.gov.uk)
[2]https://www.ons.gov.uk/peoplepopulationandcommunity/birthsdeathsandmarriages/marriagecohabitationandcivilpartnerships/datasets/marriagesinenglandandwales2013
[3]https://www.ons.gov.uk/peoplepopulationandcommunity/culturalidentity/religion/bulletins/religionenglandandwales/census2021
[4]https://www.ons.gov.uk/peoplepopulationandcommunity/culturalidentity/religion/bulletins/religionenglandandwales/census2021
[5] Formally ‘White: English, Welsh, Scottish, Northern Irish or British’ https://www.ons.gov.uk/peoplepopulationandcommunity/culturalidentity/ethnicity/bulletins/ethnicgroupenglandandwales/census2021