Although Switzerland’s central bank kicked off its latest easing cycle in late March, the second quarter started with investors digesting an above‑target reading for the Federal Reserve’s preferred price gauge and continued evidence of strong US economic growth. That prompted many to push the date they expect the Fed’s first rate cut from June to July.
This shift in sentiment dampened, but did not reverse, flows to EPFR-tracked Bond and Equity Funds during the week ending April 3. The flow picture for the latter, however, was clouded by the surge of money into a new Taiwan (POC) Dividend ETF which resulted in new weekly inflow records for Taiwan Equity Funds and all Emerging Markets Dividend Funds.
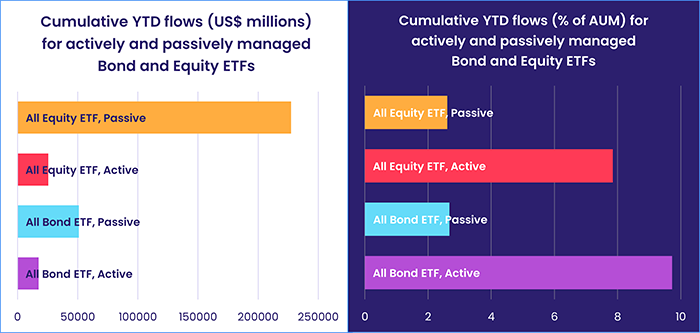
Exchange Traded Funds (ETFs) continue to absorb the lion’s share of inflows for most asset classes. Although passively managed ETFs have seen the biggest inflows in dollar terms so far this year, their actively managed counterparts are proving much more popular on a relative basis.
Overall, the latest week saw Bond Funds collectively pull in a net $13.3 billion while Alternative Funds attracted $1.5 billion and Money Market Funds over $80 billion. Flows into all Equity Funds totaled $14.2 despite another week of outflows – their 16th in a row – for funds with socially responsible (SRI) or environmental, social and governance (ESG) mandates.
At the asset class and single country fund levels, China Money Market Funds recorded their first inflow since the third week of February and China Bond Funds their third over the past five weeks. Convertible Bond Funds posted consecutive weekly inflows for the first time in over 15 months, Cryptocurrency Funds chalked up their 12th inflow year‑to‑date and flows into Inflation Protected Bond Funds hit a nine‑week high.
Emerging markets equity funds
EPFR‑tracked Emerging Markets Equity Funds started April by posting their biggest collective inflow since the first week of February. But over $5 billion of the headline number was attributable to fundraising by a single Taiwan (POC) Equity Fund, the Yuanta Taiwan Value High Dividend ETF. Without its contribution, EM Equity Funds would have been looking at their fourth straight outflow and the biggest in five months.
Funds with socially responsible (SRI) or environmental, social and governance (ESG) mandates and retail share classes continue to see money flow out, with EM SRI/ESG Equity Funds racking up their 11th outflow during the past 12 months and retail share classes experiencing net redemptions for the 14th straight week.
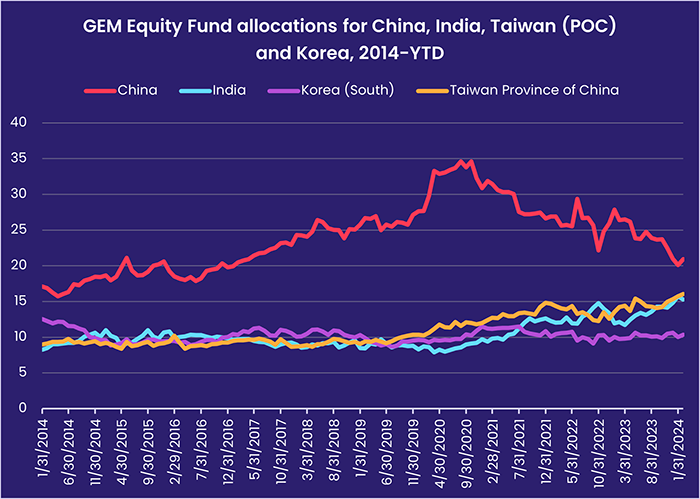
In addition to the flow into Taiwan (POC) Equity Funds, the week’s total for Asia ex‑Japan Equity Funds was buoyed by the 55th consecutive inflow for India Equity Funds. That more than offset outflows from China Equity Funds, which extended their longest run of redemptions since 3Q20, and the sixth outflow from Korea Equity Funds over the past seven weeks.
The latest country allocations data shows Global Emerging Markets (GEM) Equity Fund managers boosting their exposure to China for the first time this year while India’s average allocation slipped off January’s record high.
Investors prospecting in the EMEA universe focused on emerging European markets while avoiding most African and Middle Eastern ones. At the country level, Poland and Romania Equity Funds recorded inflows for the 10th and 20th consecutive week, respectively, while redemptions from Egypt and Nigeria Equity Funds hit 12‑year and record highs. Turkey and Africa Regional Equity Funds also posted outflows.
Latin America Equity Funds recorded their 12th outflow of 2024 as weaker commodity prices, regulatory risks, higher US interest rates and China’s economic woes sap investor enthusiasm for the region.
Developed markets equity funds
The US stock rally ran into several potholes in early April that included a more cautious assessment of the Federal Reserve’s willingness to start cutting interest rates at its June meeting to electric vehicle bellwether Tesla’s first quarter slump in deliveries. Against this backdrop, EPFR‑tracked Developed Markets Equity Funds continued to attract inflows, and daily data showed those flows regaining momentum as the week ending April 3 progressed.
The only group to experience net redemptions were Europe Equity Funds, which posted their 14th consecutive outflow. Europe Equity ETFs saw money flow out for the first time since mid‑January, but US‑domiciled funds extended their longest inflow streak in over a year and Leveraged Europe Equity Funds snapped a nine‑week run of redemptions.
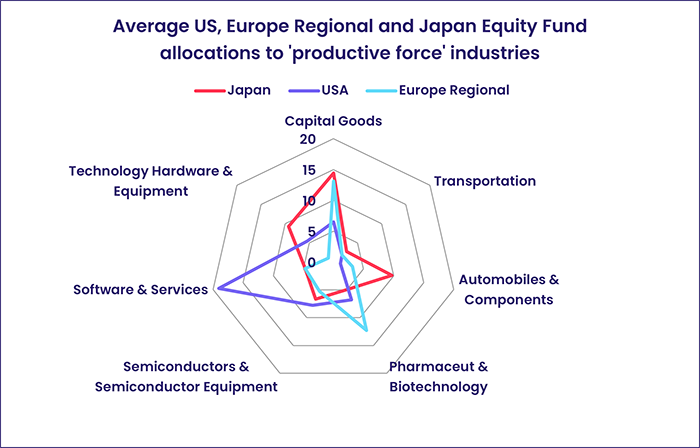
The latest industry allocations data shows that, when it comes to those expected to drive future growth, Europe Regional Equity Fund managers are tilting their exposure towards pharmaceutical companies and capital goods providers while their Japan Equity Fund counterparts are keeping faith with automotive and technology hardware plays.
US Equity Funds, which have recorded net inflows eight of the past 11 weeks, are heavily exposed to technology stocks. Retail support remains elusive, but foreign‑domiciled US Equity Funds recorded their 13th inflow year‑to‑date and funds with leverage mandates saw their third inflow since the beginning of March.
Although Japan’s benchmark Nikkei‑225 index slid off recent highs coming into April, with foreign profit taking cited as a major cause, Japan Equity Funds extended their longest inflow streak since 1H18 as flows to overseas domiciled funds rebounded to an 11‑week high.
The largest of the diversified Developed Markets Equity Fund groups, Global Equity Funds, also saw flows rebound. Flows favored Global ex‑US Equity Funds over those with fully global mandates.
Global sector, industry and precious metals funds
The week leading into the second quarter saw the number of EPFR‑tracked Sector Fund groups attracting inflows climb to seven, up from just four the previous week, with Technology Sector Funds taking in over $1.1 billion and over $400 million going into Industrials, Telecoms and Financials Sector Funds.
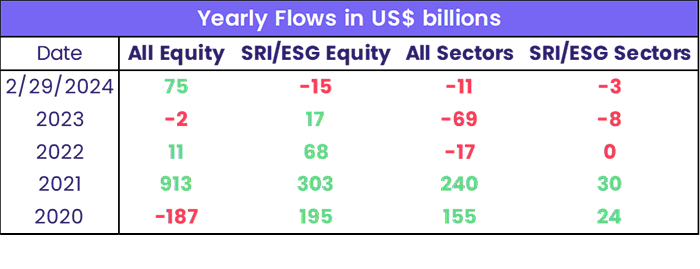
In 2021, a third (33%) of the net flows into all Equity Funds were directed towards funds with socially responsible (SRI) or environmental, social and governance (ESG) mandates and roughly 12% of the money absorbed by All Sector Fund groups went to SRI/ESG funds. In the next two years, all SRI/ESG Equity Funds proceeded to bring in fresh money – though it was nowhere near the record $302 billion in 2021 ‑ but All Sector Funds and their SRI/ESG components reported outflows. The weight of those SRI/ESG Sector Fund outflows within the broader sector universe has also picked up – accounting for just 1% in 2022 to 23% this year.
Energy and Real Estate are the largest Sector Fund groups in the SRI/ESG space, tracking $25 billion and $23 billion in total assets, respectively. But in terms of where the money is moving, SRI/ESG Energy Sector Funds have seen just a single week of inflows since the final week of 3Q23.
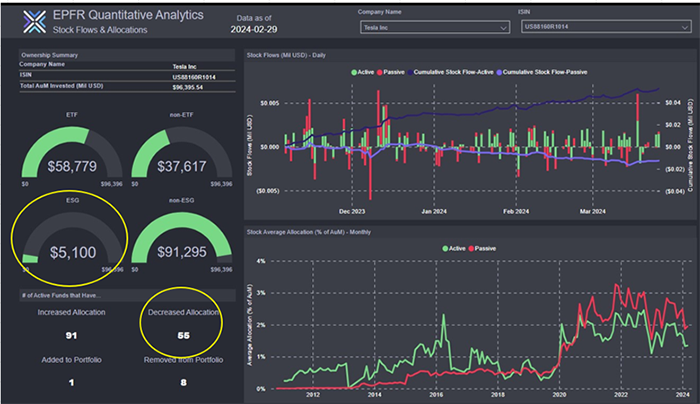
Flows into SRI/ESG Energy Sector Funds with “clean” in their name saw skyrocketing inflows in 2021, but little to no positive activity since 2023. But interest hasn’t come to a complete halt: Electric vehicles (EVs), particularly those produced by companies like Tesla, are often seen as favorable investments within the SRI/ESG framework due to their potential to reduce greenhouse gas emissions and dependence on fossil fuels.
However, holdings of Tesla stock by SRI/ESG Equity Funds account for only 7% of the total owned by all EPFR‑tracked funds, and the number of managers on both sides of the SRI/ESG divide that are cutting their exposure to Tesla is likely to increase in the wake of the company’s recent production and delivery numbers.
Industrials Sector Funds extended their current inflow streak to six weeks and more than $6 billion. It was also the group’s 11th inflow of the 14 weeks year‑to‑date. Key themes in this sector universe include Aerospace & Defense, Construction, Machines/Machinery, and Transportation/Shipping. There are only nine Industrial Sector Funds with SRI/ESG mandates, but flows as a percentage of AuM have climbed this year.
Bond and other fixed income funds
The week ending April 3 saw EPFR‑tracked Bond Funds absorb another $13 billion, taking the year‑to‑date total north of $215 billion compared to $155 billion for the same period last year. The latest data showed investors willing to take some risk, but favoring safe markets – between them, US, Europe and Global Bond Funds took in a combined $12 billion.
There were a few exceptions. Although the latest auctions of Japanese government bonds attracted solid demand, uncertainty about the impacts of the Bank of Japan’s first steps in the long journey towards normalizing monetary policy chased money out of Japan Bond Funds for the third time over the past four weeks. The latest redemptions were the biggest in eight months.
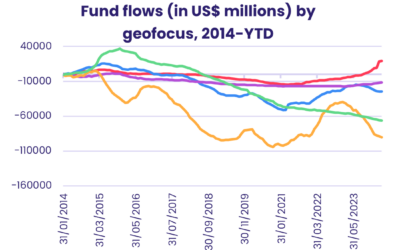
Investors also dipped their toes back in the emerging markets pool, with Emerging Markets Bond Funds posting their third inflow of 2024 on the back of the biggest inflow for the diversified Global Emerging Markets (GEM) Bond Funds since mid‑November. At the country level, outflows from Turkey, Korea, South Africa and Brazil Bond Funds hit 13, 14, 18 and 210‑week highs, respectively.
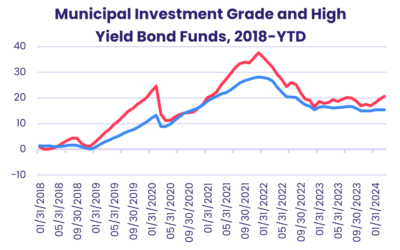
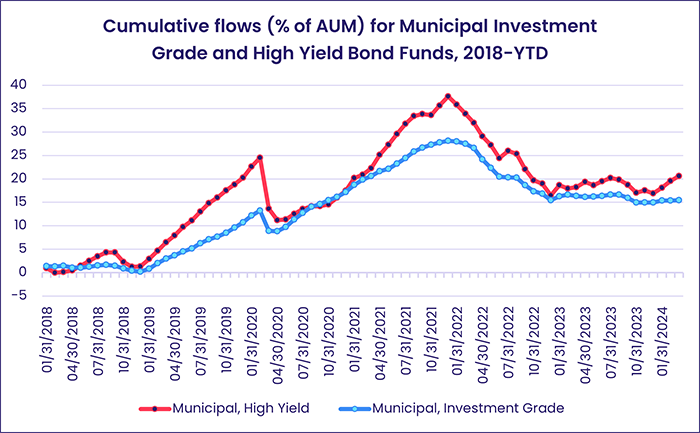
Among the major asset class groups, Mortgage‑Backed Bond Funds extended their longest run of inflows since 1H21, flows into Bank Loan Funds hit a two‑year high, Inflation Protected Bond Funds recorded their fifth inflow year‑to‑date versus twice during all of 2023, and High Yield Bond Funds chalked up their 12th inflow of the year. Redemptions from Municipal Bond Funds jumped to a 13‑week high as High Yield Muni Funds posted their first outflow since early January.
Europe Bond Funds absorbed another $1.5 billion coming into April with Europe ex‑UK Regional and Switzerland Bond Funds both taking in over $400 million. Retail share classes extended an inflow streak stretching back to mid‑September and funds with socially responsible (SRI) or environmental, social and governance (ESG) mandates chalked up their 14th consecutive inflow.
Both of the major North American groups recorded solid inflows which, in the case of Canada Bond Funds, hit their highest level in over 15 months. Canada Bond Funds with corporate mandates fared better, in flow terms, than their sovereign counterparts for the 21st straight week. Over the past six months, long term (over 10 years) has been the preferred duration while Intermediate Term US Bond Funds have attracted the most fresh money over that period.
Did you find this useful? Get our EPFR Insights delivered to your inbox.