
If you’re a small business in the U.S., you’re not required to provide paid time off (PTO) to your employees. However, you may still choose to offer it anyway. PTO gives workers the chance to take a break from work and avoid burnout. It can also raise their morale and improve their productivity.
With the PTO statistics below, you can get a better idea of how much time off employees in America and other countries take and even determine what type of PTO policy makes sense for your unique business.
Key PTO Statistics and Trends
Here’s a look at some of the most noteworthy PTO statistics and trends. You may find some of them to be quite surprising.
Twenty-eight million Americans don’t get any paid vacation or paid holidays
The United States is the only advanced economy in the world that does not guarantee its workers paid vacation days and paid holidays.1 This means that employees can work for months or even years without any break, lacking the work-life balance that is important for their physical and mental well-being.
Nearly a third (31%) of U.S. employees do not have access to PTO
Job type and industry can often determine whether or not workers have the option of PTO. If an employee is in a position where they are constantly in front of clients or customers, for example, their chance of PTO may be lower than a worker whose job requires a lot of back end or behind-the-scenes work.1
Over half (52%) of employees report working while on PTO
Just because workers take PTO doesn’t mean they sit back, relax and completely forget about their jobs. In fact, more than half of them say they work when they’re supposed to be off the clock.2 Some might check their emails or hop on conference calls every so often while others may put in hours and hours of work.
Over 765 million vacation days have gone unused by Americans
While vacation days are designed for U.S. workers to take time off and recharge, not everyone takes advantage of them.3 This may be because they forget to use them, don’t want to use them or believe they can’t use them because they’re overwhelmed with work or feel like they have too much to get done.
Featured Partners
1
OnPay
Yes
Yes
$40 per month + $6 per user
2
SurePayroll
Yes
Yes
$29.99/mo plus $5 per employee
3
Gusto
Yes
Yes
$40 per month plus $6 per user
4
Rippling
Yes
Yes
$35 per month + $8 per user

Average Vacation Days per Year
When it comes to annual vacation days, numbers vary greatly. There is no hard and fast number employers in the United States must follow.
The average American worker gets 11 days of paid vacation per year
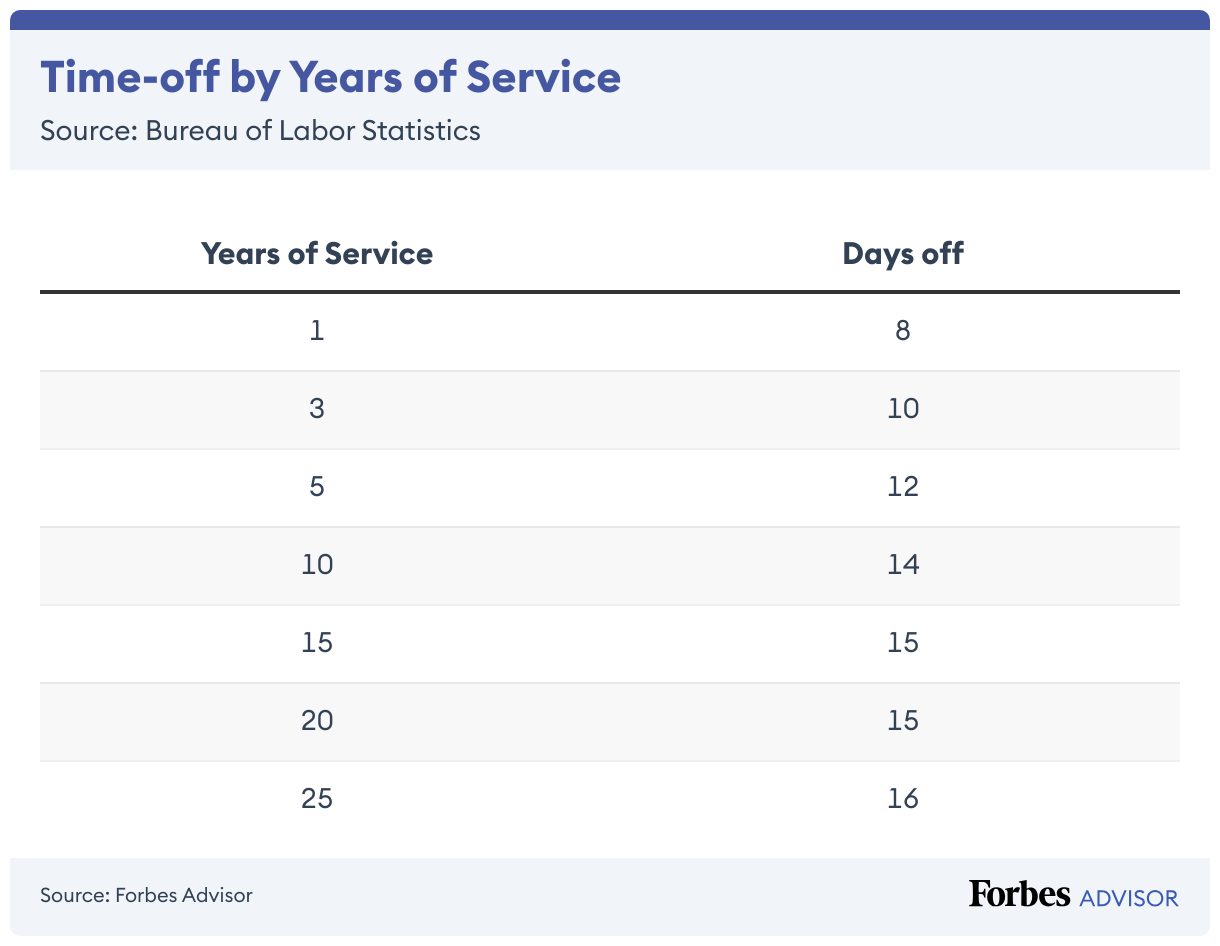
In the private sector, the average number of paid vacation days after five years of service increases to 15 days.4 After 10 years of service, it rises again to 17 days. For employees with 20 years of service or more, the average number of paid vacation days is 20. Keep in mind that these are strictly averages as there is no guaranteed PTO in the U.S.
On average, U.S. workers get eight days of sick leave per year
There is often a connection between how many sick days an American worker gets and their employment status. In general, the more often they work and longer they’ve been in their position, the more sick days they receive. The average number of paid sick days is as follows:4
- Eight days per year for full-time workers
- Six days per year for part-time workers
- Eight days per year for workers who received a fixed number of paid sick days after one year of service
- Ten days per year for union workers, after one year of service
- Seven days per year for nonunion workers, after one year of service
The average employee in the U.S. receives an average of 7.6 paid holidays
Though the national average is 7.6, statistics show that 21% of U.S. employees receive six paid holidays per year.4 The most common paid holidays in the United States are Thanksgiving, Christmas, Independence Day, New Year’s Day, Memorial Day and Labor Day. Of course, some employers give their workers more or less paid holidays. They may even offer floating holidays, which are paid days off that workers can take at any time during the year.
Federal employees have 11 annual paid holidays
While PTO is optional, there are certain paid holidays that are legally required for federal workers in the U.S. These holidays for federal employees include:5
- New Year’s Day (January 1)
- Birthday of Martin Luther King, Jr. (Third Monday in January)
- Washington’s Birthday (Third Monday in February)
- Memorial Day (Last Monday in May)
- Juneteenth National Independence Day (June 19)
- Independence Day (July 4)
- Labor Day (First Monday in September)
- Columbus Day (Second Monday in October)
- Veterans Day (November 11)
- Thanksgiving Day (Fourth Thursday in November)
- Christmas Day (December 25)
Men and women are entitled up to eight weeks of parental leave per child1
In 2018, the U.S. Bureau of Labor Statistics found that only 17% of companies offered paid parental leave and 89% offered unpaid.6 The state of New York, which has the most generous program, allows parents to take up to 12 weeks of Paid Family Leave at 67% of their pay, up to a cap.7
PTO Usage Statistics
The reality is that despite the benefits of PTO, not all workers take it. If you don’t think employees are using enough of their hard-earned time off, make sure that your payroll service of choice can track what they’ve used and send reminders to rest and recharge.
Below are some interesting statistics on how often PTO gets used.
Employees take an average of 20.3 days off per year
In 2018, Americans used an average of 17.4 days of PTO, a slight increase from the 17.2 days in 2017.3 These figures show that, at least before the COVID-19 pandemic, it was typical for U.S. workers to take anywhere from two to three weeks off work.
Employees don’t use 6.5 days of their PTO1
More than a quarter (27.2%) of PTO went unused in 2018—up from 25.9% in 2017. In 2018, 55% of Americans reported having unused vacation days. This was up from 52% the year prior. More than half of Americans (55%) are still not using all their paid time off.3
Nearly a third (31%) of employees report mandatory paid time off as a top benefit to offer
Mandatory PTO means that workers are required to take a certain amount of time off. While the amount of time is up to the employer, it might be a single week, five sporadic days or one day per month. Some businesses may even have monthly, quarterly or annual deadlines for their workers to use their PTO. According to a survey conducted by Forbes Advisor, over 30% of employees highly value mandatory PTO.
Unlimited PTO Statistics
Unlimited PTO means that workers can take as much or as little PTO as they want. They’re not assigned a set number of days and have the freedom to take breaks from work whenever they’d like.
Only 4% of companies offer unlimited PTO in the U.S.17
At this time, unlimited PTO is not the norm. A small number of American employers across all industries currently offer it. However, 20% of companies in the tech, media and finance industry report providing unlimited PTO.8
A majority of employees are interested in unlimited PTO
Even though unlimited PTO might be hard to come by these days, 70% of workers like the idea of it.9 In fact, many of them hope they’re offered this perk at some point, either through their current employer or a future employer. Unlimited PTO provides them with a level of freedom they won’t get with a more structured PTO policy.
Job postings with unlimited PTO have risen 178%
From 2015 to 2019, job postings on Indeed with unlimited PTO increased from 450 postings per million to 1,300 postings per million.10 This is great news as it shows that many companies are starting to realize the benefits of unlimited PTO and are willing to offer it to their workers.
Over a quarter of employees prefer unlimited PTO
The same amount, 27%, report being happy with two weeks of paid time off. While 29% prefer to have a PTO bank that accrues time over the course of the year.11 It’s clear that not all employees have the same preference when it comes to PTO.
On average, employees with unlimited PTO only take 10 days off
The average American takes 17 PTO days a year3 while workers with unlimited PTO take 10 days off.11 We can see that just because an employee has an option to take as much time off as they want doesn’t mean they actually will. Some workers might be hesitant to take advantage of an unlimited PTO policy because they don’t want to seem like they’re abusing the privilege.
Employees with unlimited PTO report the best work-life balance
Sixty-two percent of workers with unlimited PTO report a healthy work-life balance while 53% of employees with a fixed two weeks of time off report a healthy work-life balance.11 Workers may feel good about their work-life balance, regardless of if they have unlimited PTO or a predetermined PTO schedule to follow.
Forty-two percent with unlimited PTO “always” work on vacation
Thirty-seven percent with vacation accrual plans report “always” working on vacation.12 Unlimited PTO doesn’t mean workers will “slack off” or forget about their responsibilities. It may actually encourage them to become more productive and go above and beyond what’s expected of them.
Paid Time Off by Occupation and Industry
Oftentimes, there’s a link between PTO and occupation and industry. The PTO statistics below support just that.
Sixty percent of tech workers report getting between two and four weeks of paid vacation days
Many tech employers offer PTO to their workers. They’re often in the know with the latest employment trends and understand what their workforce appreciates, so this is expected. Note that 21% of the tech companies that offer PTO give less than two weeks.13
Most (95%) of employees in finance and/or manufacturing had access to paid vacation leave
It’s not uncommon for those in the finance and manufacturing industries to work long hours. Therefore, it’s great that almost all of these workers are able to take at least some time off and unwind from their demanding careers. Paid vacation leave may help them avoid burnout and prevent turnover.14
Less than half of employees in leisure and hospitality had access to paid vacation leave
Compared to other industries, leisure and hospitality has one of the lowest PTO rates at 43%.4 Workers in places such as hotels, restaurants and casinos are always needed to serve their customers during the week and on the weekends. Unfortunately, the limited or lack of time off may contribute to the industry’s high turnover rate.
Average Paid Leave by Years of Service
The amount of time a worker has been with a company often impacts how much PTO they receive. In general, paid time off increases with years of service with a business.4
The average paid time off for full-time employees in the United States is as follows:
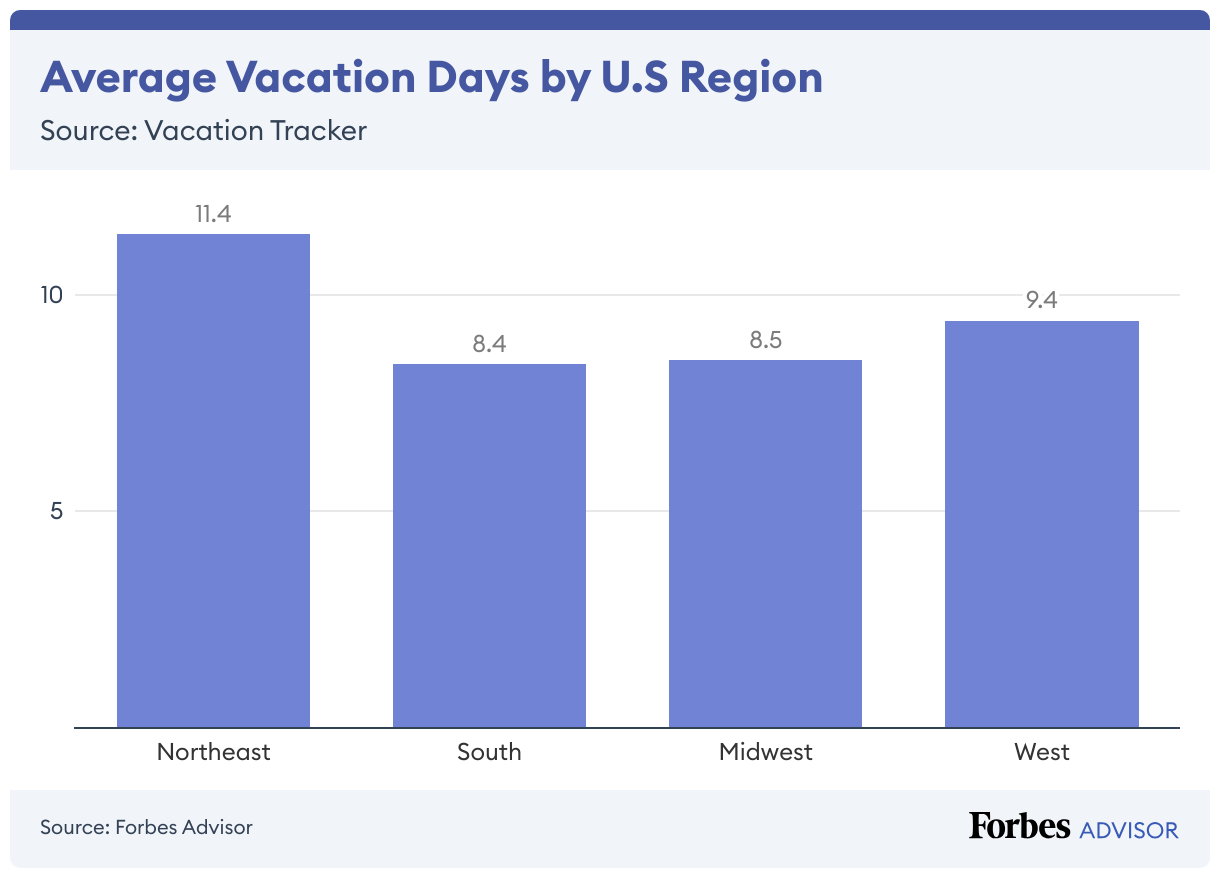
Average PTO by U.S. Region
Geographic location can also play a role in a worker’s PTO. Some parts of the U.S. are known to offer more PTO than others.
Northeastern workers have the highest average PTO available
Employees in states such as New York, New Hampshire, Maine, Vermont and Connecticut enjoy access to an average of 11.4 PTO days per year.15 This means that if they ever move to another part of the country, they may not have as much time off.
Southern and Midwestern workers have similar PTO available
Companies in Southern states such as Florida, Louisiana, Georgia, Tennessee and Alabama usually offer an average of 8.4 PTO days. PTO is similar for workers in the Midwest in states such as Ohio, Michigan and Indiana as it averages 8.5 days.15
Western states average 9.4 days of PTO
Compared to Southern and Midwestern states, Western states tend to have a slightly higher PTO day average. However, this increase is so minor that it’s unlikely it will make much of a difference in a worker’s work-life balance and overall job satisfaction.15
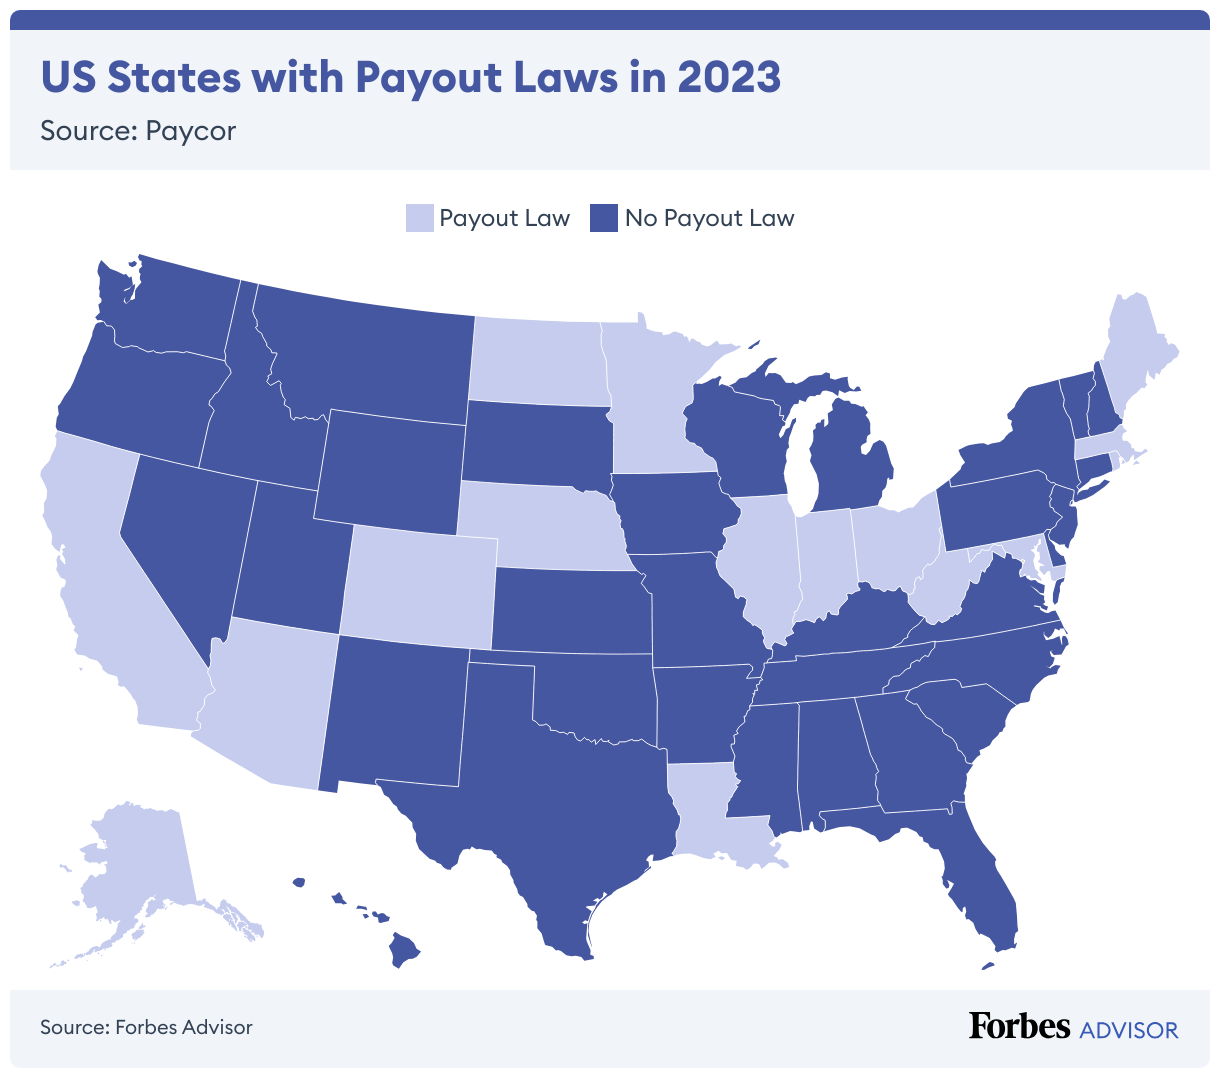
PTO Payout Laws by State
A PTO payout or PTO cash out is when a company pays its workers for unused PTO when they leave. Below is a look at payout laws by state.
Sixteen states require PTO payouts
There are quite a few states that make PTO payouts mandatory for companies. These states include Alaska, Arizona, California, Colorado, Illinois, Indiana, Louisiana, Maine, Maryland, Massachusetts, Minnesota, Nebraska, North Dakota, Ohio, Rhode Island and West Virginia.16 Workers in these states will get compensated for the PTO days they don’t use.
Over three quarters of companies report allowing employees to rollover unused PTO
Sometimes, unused PTO simply goes to waste. However, 77% of companies let workers carry some or all of the time they didn’t use into the next year.17 Employees can pair their “rolled over time” with the new PTO they’ll receive and maximize their time off that year. They might do this because of an upcoming life event, such as the birth of a child or multiple vacations they have planned.
PTO in the U.S. versus Other Countries
The amount of PTO American workers typically receive is far less than what employees in other countries are used to. This may be the reason behind our “burnout nation,” in which U.S. workers feel overwhelmed and stressed about their jobs.
Countries with the most paid vacation days
The average amount of PTO provided in the U.S. is 10 days, which feels miniscule compared to countries with the most generous PTO allowances. The Middle East and Europe lead the charge here, with Iran and Yemen providing nine to ten weeks of leave each year on average. Companies in San Marino and Andorra also typically provide about nine weeks of PTO.18
Countries with the least paid vacation days
On the other end of the spectrum, there is only one country that seems to offer less PTO than the United States: the small island nation of Micronesia. Nauru, an independent nation in the same region, is tied with the U.S., offering just 10 vacation days per year.18
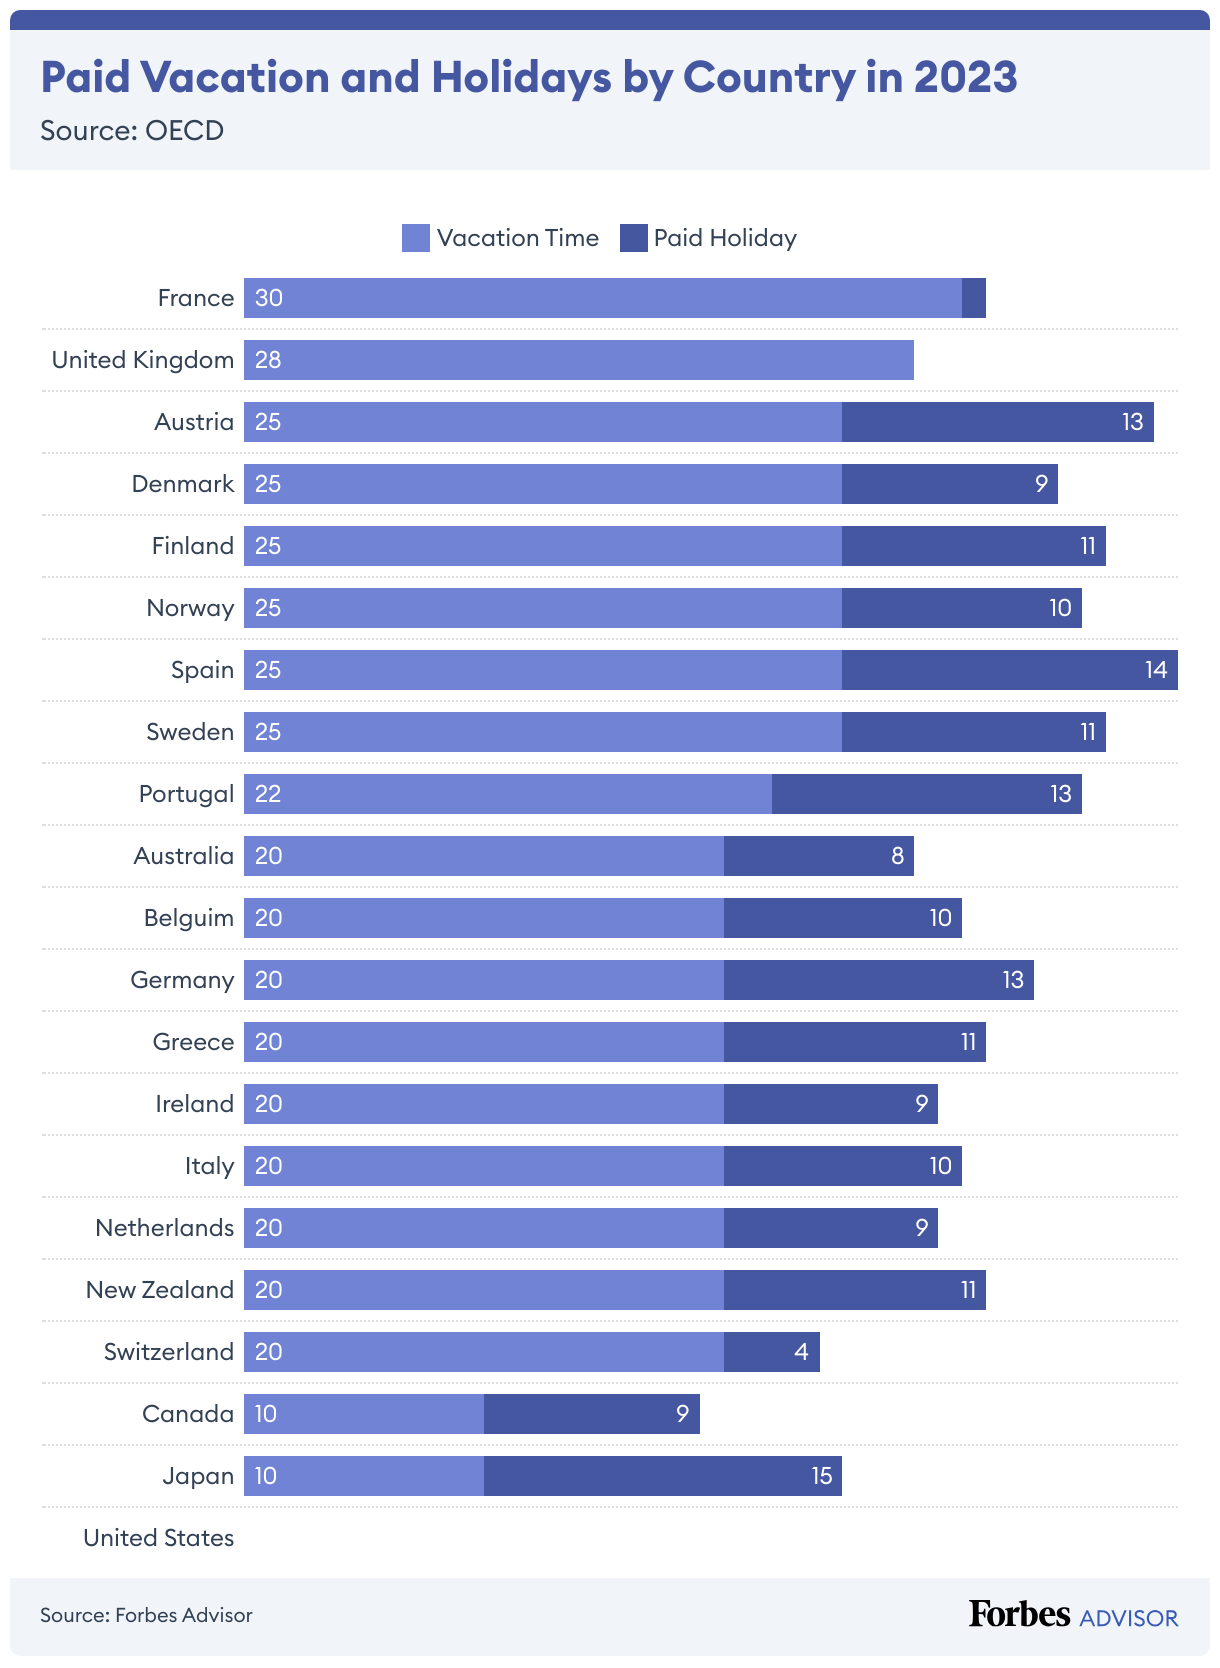
European countries have a minimum of at least 20 days of paid leave annually18
France offers the most paid leave in Europe with 31 days of paid leave.19 The U.K. offers the second-most paid leave in Europe with 28 days of paid annual leave.20 This is equivalent to 5.6 weeks but workers must work a five-day week to enjoy 28 days of leave.
Of the OECD countries, Spain offers the most paid time off
Spain provides 25 paid days off and 14 paid holidays per year for a total of 39 days of annual leave.19 This means almost a month and a half of time off for Spanish workers.
The U.S. is the only OECD country with zero guaranteed paid leave
Unfortunately, the United States has no guaranteed paid day off or paid holidays.19 Every other country, however, has this requirement. The optional rather than mandatory PTO in the U.S. might be why American workers are often burned out and have a poor work-life balance.
Japan has the most paid holidays of any OECD country
Japan has 15 paid holidays, compared to 14 in Spain and zero in the U.S. The country’s employers also offer 10 paid vacation days.19 It’s interesting that despite this, many Japanese workers are dissatisfied with their jobs.
Conclusion: What do these statistics mean for small businesses?
Clearly, the United States has a long way to go in regards to cultivating a culture that respects the need for adequate personal time away from work, as even when a generous amount of PTO is available employees may feel pressured not to take it. Ensure that your business’s PTO policy takes this into consideration and that no one feels like they can’t step away. And make sure that you have a clear system for tracking PTO accrual and usage; a feature that should be standard even in free payroll software.
Visit our hub to view more statistic pages.
Sources
- Zippia
- Quickbooks
- U.S. Travel Association
- U.S. Bureau of Labor Statistics
- U.S. Office of Personnel Management (OPM)
- Forbes
- New York State Official Site
- U.S. News
- MetLife
- Indeed
- Joblist
- Insider
- DICE
- The Balance
- Vacation Tracker
- Paycor
- Society for Human Resource Management (SHRM)
- Resume.io
- Center for Economic and Policy Research (CEPR)
- GOV.UK