Comparing measurements of head motion and centre of pressure for body sway induced by optic flow on a head-mounted display
 Hiroshi Ashida
 Kanon Fujimoto
- Graduate School of Letters, Kyoto University, Kyoto, Japan
We compared two measures of visually induced body sway—head motion and centre of pressure (CoP)—that were simultaneously measured while observing optic flow on a head-mounted display (HMD). Head motion can be conveniently tracked with HMDs, but may have some features different from those of conventional CoP measurements, because of the complex joint structures of the human body. In this analysis, the responses were very similar (except for response gain), and we did not find any significant differences in time or frequency domains. Our results support the use of head motion as a potential predictor of variability in body sway, at least in studies of visually guided postural control.
Introduction
Visual optic flow induces a sense of self-motion referred to as ‘vection’ that affects our postural control (Dichgans and Brandt, 1978). Vection can be useful in assessing virtual reality (VR) experiences as an indicator of immersion and possibly sickness, but it is often criticised for lack of objectivity. Postural sway is expected to serve as a more objective alternative measurement (Palmisano et al., 2015). Current HMD products have built-in gyro sensors, and some also have external sensors that track the head position in order to update the visual display following the viewers’ movement; therefore, head movement can be accurately tracked without extra equipment (Kim et al., 2015). We have utilised this feature and found that the lower visual field offers superior advantages in postural control and vection (Fujimoto and Ashida, 2019) and opposite sway to optic flow in standing and sitting postures (Fujimoto and Ashida, 2020). Here we sought evidence for the support and validity of head-motion measurement as a way to monitor body sway in subjects wearing an HMD.
Studies of postural sway conventionally measured centre of pressure (CoP), as a proxy for centre of mass (CoM; also called centre of gravity; see Murray et al., 1967). CoP is measured with a force plate on which the participant stands and has been utilised in studying the effect of optic flow on postural control (Bertenthal et al., 1997; Chowdhury et al., 2021; Horiuchi et al., 2021; Sugiura et al., 2015). CoM is computed as the weighted average of segments and thus requires tracking of multiple points on the body (Lafond et al., 2004). The relationship between CoP and CoM has been closely examined (Murray et al., 1967; Lafond et al., 2004). CoM can be practically derived from CoP, but it is less clear how head motion is related to CoP. Saldana et al. (2017), using a VR HMD, assessed postural balance in older adults and obtained similar results with head motion and CoP, but direct comparisons of the responses were not made. Lubetzky et al. (2022) reported strong correlations between head and CoP responses to visual anterior-posterior motion, but also mentioned discrepancies under dual-task conditions. Their visual stimuli of abrupt movements of visual walls were not optimal for inducing vection.
The purpose of this study was to concurrently measure and compare head motion with CoP, while viewing visual optic flow that would induce substantial vection. Standing on a force plate while wearing an HMD, participants observed optic flow simulated forward and backward motion. To fully assess the influence of the visual effects, we reversed the optic flow direction (forward/backward) periodically and analysed the resulting changes in postural sway in both time and frequency domains. An increase in the frequency of directional oscillation is an indicator of visually guided body sway (van Asten et al., 1988; Bertenthal et al., 1997; Chowdhury et al., 2021; Sugiura et al., 2015).
Methods
Participants
Seventeen healthy undergraduate students of Kyoto University participated in this study as part of a 2021 course requirement (age: 19–23 years, mean = 20.5 years; seven females, nine males, and one participant of undisclosed gender). They had either normal or corrected-to-normal vision. Written informed consent was obtained for participation and for anonymous use and publication of the data. The experimental procedure was conducted in accordance with the Declaration of Helsinki and was approved by the ethics committee of the Psychological Science Unit, Kyoto University (No. 29-P-6).
In a preliminary experiment with 21 students (data not included due to technical problems), the measured phase-lag correlation between the two methods (see below) was strong (Pearson’s coefficient r was >0.75, including an outlier). On the basis of this, a post-hoc power analysis using G*Power 3.1 (Faul et al., 2009) showed that the power (1-β) exceeded 0.98 for the correlation analysis for 15 participants in the current experiment (given that data from two participants were partially missing). The power for interactions in ANOVA with a full within-factor design could not be assessed with G*Power.
Apparatus and stimuli
We presented a radial optic flow of random dots (Figure 1) on a head-mounted display (Oculus Rift CV1, Meta Platforms, Inc., Menlo Park, CA, United States) controlled by a PC running Windows 10 (Microsoft, Redmond, WA, United States). The display resolution was 1,080 × 1,200 pixels for each eye, subtending about 110 degrees of visual angle diagonally, and the refresh rate was 90 Hz. The visual stimuli were created and controlled with the 3D Unity engine 5.6.0f3 (Unity Technologies, San Francisco, CA, United States). The apparatus and stimuli were adapted from our previous work (Fujimoto and Ashida, 2019; Fujimoto and Ashida, 2020).
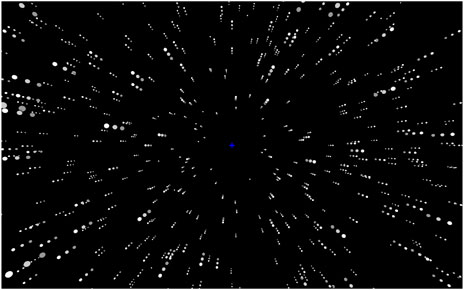
FIGURE 1. Schematic view of the optic flow stimulus. Successive frames were superimposed to give the impression of expanding or contracting motion.
The position of the HMD was recorded at a rate of 50 Hz as a measure of participants’ head motion. The centre of pressure was measured concurrently while standing on a force plate (Wii Balance Board, Nintendo, Kyoto, Japan) that was controlled by another Windows-10 PC at a variable sampling rate of up to 100 Hz (see Audiffren and Contal, 2016).
The optic flow stimuli consisted of white dots (implemented as spheres) presented on a dark background, which were scattered in the 3D space (see Fujimoto and Ashida, 2020, for details). The virtual camera moved backward and forward at a constant speed of 9.4 m/s in the Unity space, resulting in expanding and contracting optic flow in 3D (with binocular disparity) that changed directions at a rate of 0.1 Hz or 0.05 Hz (i.e., changing directions in a cycle of 5 s or 10 s; see Figure 2A). We used relatively slow oscillations because the building up of vection is known to take a few seconds (Palmisano and Riecke, 2018). About 450 dots were visible at any moment. A baseline condition was also run in which the dots were stationary throughout the trial.
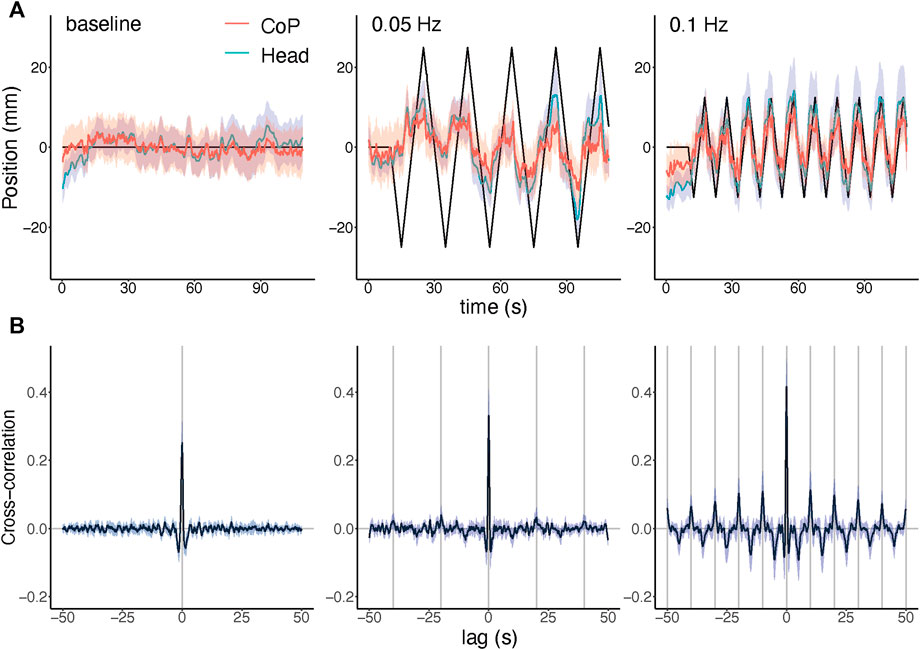
FIGURE 2. Results in the time domain. (A) Averaged CoP and head motion along the anterior-posterior (A–P) axis throughout the trial, for the baseline, 0.05 Hz change rate, and 0.1 Hz change rate conditions. Solid lines show simulated body motion by the optic flow. (B) Cross-correlations between head motion and CoP, each corresponding to the above time-series plot. Grey vertical lines indicate 0 lag and stimulus cycles for each condition. In all panels, shaded areas show 95% confidence intervals.
Procedure
Participants were tested one-by-one. With aid from the experimenter, the participant wore the HMD on top of a disposable HMD mask and stood on the balance board with their shoes off. Then, each of the three conditions (0.1 Hz, 0.05 Hz, and stationary baseline) was tested once. The first trial was always the baseline, and the order of the other two conditions was counterbalanced across participants. Participants had brief rest periods between trials, while they maintained their standing position. The sessions lasted about 10 min for each participant.
At the beginning of each trial, the participant was asked to look straight ahead and align a small head-contingent white disk inside a larger disk that was fixed in the environmental space. When the participant aligned the disks together for 3 s, the disks disappeared and the trial started. After 10 s of viewing static stimuli, the optic flow stimuli were presented for 100 s. The participant was instructed to stand still and look straight at the centre of the flow (i.e., the focus of expansion/contraction). After each trial, we asked participants to rate their feelings of body movement by verbally reporting a number between 0 (no movement) and 100 (extremely strong movement).
Analyses
We used MATLAB (version 2021b; MathWorks, Inc., Natick, MA, United States) and RStudio (2022.02.3, RStudio Team, 2022; with R version 4.1.2, R Core Team, 2021) for data analyses and plotting figures. We used JASP (version 0.16.3, JASP Team, 2022) for statistical tests of classical and Bayesian ANOVA. If Mauchly’s test of sphericity indicated that the assumption of sphericity was violated (p < 0.05), the Greenhouse-Geisser correction was applied. We used the Holm-Bonferroni method of adjustment for post-hoc comparisons. We also used the ‘anovakun’ function of R (free software by Ryuta Iseki, version 4.8.7) for post-hoc comparison of the peak powers (see below). The subjective ratings of body movement were analysed by one-way repeated-measures ANOVA for the three levels of direction-change rate (baseline, 0.05 Hz, 0.1 Hz).
Time-series signals of head position and CoP along the anterior-posterior axis of the body, which were directly related to the optic flow, were extracted and pre-processed. The CoP data were resampled at 50 Hz, and the time stamps were adjusted to the head position data by using a trigger signal from the main PC. Signals from each run were low-pass filtered by using a fifth order Butterworth filter with a cut-off frequency of 10 Hz (following Palmisano et al., 2014) to remove high-frequency artefacts that emerged frequently in the CoP data. The phase response was −0.014 rad at 0.05 Hz and −0.028 rad at 0.1 Hz, which can be treated as negligible in our results. The correlation of time-series signals (Pearson’s r) at 0 lag was computed as a crude index of similarity. The cross-correlation of time-series signals between the two measurements was computed for each condition after removing linear trends and autocorrelations from each run of the time-series signals by taking the first-order differences.
Power and phase spectra were computed by fast-Fourier transform. The log-power values at the frequency of directional changes (0.05 Hz and 0.1 Hz) were extracted and fed into a three-way repeated-measures ANOVA (measurements: head motion, CoP; direction-change rate: 0 Hz, 0.05 Hz, 0.1 Hz; peak frequency: 0.05 Hz, 0.1 Hz). Post-hoc comparisons were made for the relevant pairs at each peak frequency. A Bayesian repeated-measures ANOVA was also conducted for supporting null effects.
The angular phase lag was defined as the phase value of the measured head motion and CoP signals subtracted from that of the simulated body motion (camera position), at the frequency of direction change. As the phase values were circular, they were adjusted to fall between −π and π. By this definition, positive values indicate body motion in the direction of the simulated self-motion, while negative values indicate body motion in the opposite direction of the simulated self-motion, with some response lags. The correlation (Pearson’s r) between the phase-lags of the two measurements was analysed with a t-test. The phase lags were analysed by a two-way repeated-measures ANOVA and a two-way Bayesian repeated-measures ANOVA.
We also applied detrended fluctuation analysis (DFA) by using the MATLAB code provided by Wenye (2020), which can give insights in long-range correlations in non-stationary time series (Peng et al., 1995). The scaling exponent α was compared across measurements and conditions by repeated-measures ANOVA using JASP.
Only the relevant parts of the statistical results are reported below. See tables of ANOVAs in the supplementary documents for details.
Results
The CoP data were missing for two participants in the 0.05 Hz direction change condition, due to a technical problem. The entire block of data from these two participants was excluded for ANOVAs, but available portions were included in the other analyses.
Subjective rating
The averaged rating of subjective body motion was 18.9 for the baseline, 73.7 for the 0.05 Hz direction change, and 75.9 for the 0.1 Hz direction change. The effect of stimulus condition was significant [F (2, 32) = 51.47, p < 0.001, η2 = 0.763; Supplementary Table S1A)]. The baseline condition yielded a significantly lower rating than the 0.05-Hz and the 0.01-Hz conditions, while the difference between the 0.05 Hz and 0.1 Hz conditions was not significant (Supplementary Table S1B). While conscious vection was not a necessary condition in this study, the data confirmed that our optic flow stimuli were effective in simulating forward and backward movement.
Time course
Figure 2A shows the average time courses of head motion and CoP under each stimulus condition. Responses were modulated by changes in optic flow direction, and head motion and CoP responses were very similar in shape, as the correlation between HM and CoP signals was reasonably high (baseline: r = 0 .849, 95% CI = 0.810–0.889; 0.05 Hz: r = 0.880, CI = 0.833–0.927; 0.1 Hz: r = 0.877, CI = 0.837–0.916; p < 0.001 for all individual participants). Cross-correlation (Figure 2B) was maximum at 0 lag in every condition, showing no temporal delays relative to each other. Smaller local maxima and minima were found in the 0.1 Hz condition, reflecting the repeated stimulus cycles, while local peaks were less clear in the 0.05 Hz condition.
Although the averaged responses look similar to the simulated motion, the responses were actually shifted leftward as compared to the simulated motion, suggesting that the body response was negatively correlated with the simulated motion with long and variable latency, which was consistent with previous results in a standing posture (Fujimoto and Ashida, 2020). Such anti-flow responses were better seen at the beginning of the first cycle of the optic flow stimuli. This point will be discussed in the section on phase lag below.
Power spectra
Figure 3 summarises the results of frequency analyses. In the log-power spectra (Figure 3A), there were prominent local peaks at the frequency of directional changes (0.05 Hz and 0.1 Hz). To confirm this observation, log-power values at these peak frequencies (depicted by the vertical solid lines) were extracted and fed into three-way repeated-measures ANOVA (Supplementary Table S2A). Mauchly’s test of sphericity indicated that the assumption of sphericity was violated (p < 0.05). The Greenhouse-Geisser correction was also applied. First, the three way interaction was not significant [F (1.797, 25.16) = 1.199, p = 0.314]. Second, the two-way interaction between direction-change rate and peak frequency was significant [F (1.355, 18.97) = 40.59, p < 0.001, η2 = 0.333], supporting the stimulus-dependent increase of power. Post-hoc comparisons (Supplementary Table S2B) confirmed that the increase of power was specific to the direction-change rate (0.05 Hz > 0.1 Hz = baseline at the peak frequency of 0.05 Hz and 0.1 Hz > 0.05 Hz = baseline at the peak frequency of 0.1 Hz). Third, and most importantly, no interaction with measurements was significant (measurements × direction-change rate: [F (1.977, 27.68) = 0.197, p = 0.820; measurements × peak frequency: F (1,14) = 0.330, p = 0.575], while the main effect of measurements was significant [F (1,14) = 128.0, p < 0.001, η2 = 0.064], suggesting that measurements did not affect the results except for overall response gain. In addition, the main effect of direction-change rate was significant [F (1.762, 24.68) = 9.499, p = 0.001, η2 = 0.048]; but this was trivial, reflecting smaller power in the baseline condition than the other two conditions (Supplementary Table S2C), which is natural as the visual stimulation was stationary. The main effect of peak frequency was not significant [F (1, 14) = 2.541, p = 0.133].
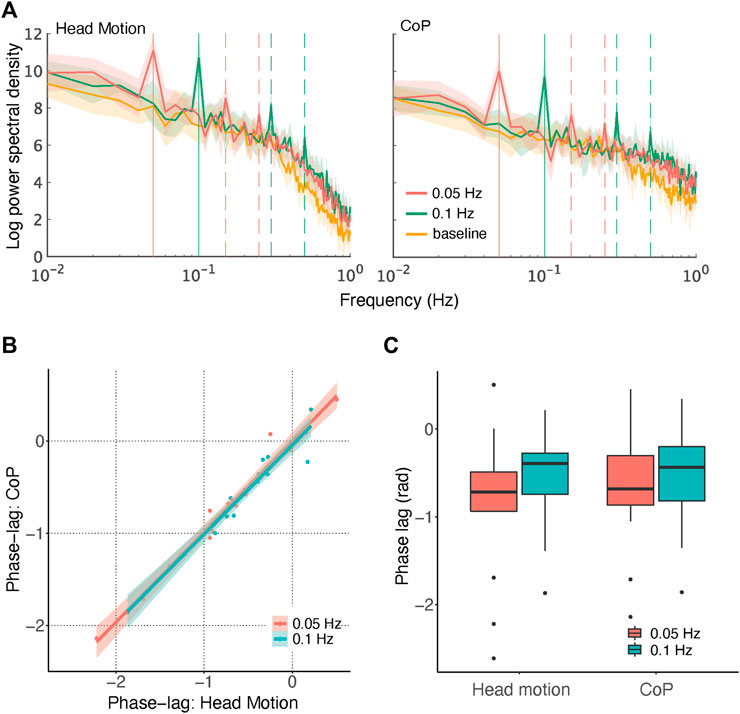
FIGURE 3. Results in the frequency domain. (A) Log-power spectra for each condition with 95% confidence intervals. Vertical solid lines depict the frequencies of direction changes, and dashed lines depict their third and fifth harmonics. (B) Correlation of phase lags between head motion and CoP. Fitted linear functions are shown with 95% confidence intervals. (C) Box plot of phase-lag values.
Bayesian ANOVA (Supplementary Table S2D) confirmed that the best model comprised all three main effects and an interaction only between direction-change rate and peak frequency (BFM = 34.00; see Supplementary Table S3A). Extremely strong evidence was found for each main effect (measurement: BFincl = 1.979 × 10⁴; direction-change rate: BFincl = 2.186 × 10⁷; peak frequency: BFincl = 9.689 × 10⁵) and the interaction between direction-change rate and peak frequency (BFincl = 2.481 × 10⁶). Weak evidence against inclusion was found for the interactions with measurements (measurement × direction - change rate: BFincl = 0.408; measurement × peak frequency: BFincl = 0.701; three way: BFincl = 0.358). Consistent with the classic ANOVA results above, it is evident that measurements did not interact with other factors. Additionally, the peaks at the third and fifth harmonic frequencies are noticeable in Figure 3A (depicted by the dashed lines). We did not analyse these peaks formally, but their appearance suggests that the postural sway had somewhat of a rectangular wave form rather than a smooth sinusoidal form, which is plausible given the limited range of body inclination.
In summary, the power spectra results indicated an increase in power at the frequency of the direction-change, but no effects on the measurements other than a slightly smaller overall power relative to head motion. The first point confirmed that the optic flow stimuli successfully induced postural sway. The second point supports the hypothesis that the measured head motion and CoP were largely consistent in temporal dynamics.
Phase lags
As shown in Figure 3B, phase lags were strongly correlated between the two measurements for each direction-change rate [0.05 Hz: r = 0.985, t (13) = 20.78, p < 0.001; 0.1 Hz: r = 0.974, t (15) = 16.51, p < 0.001], providing another piece of evidence supporting the similarity between head motion and CoP. The phase lags were mostly negative between −π/2 and 0, confirming what was noted previously, that the postural responses to simulated head motion were compensatory rather than anticipatory and that the latency was large and variable across participants. Two-way repeated-measures ANOVA (Supplementary Table S3A) revealed no significant effect [direction-change rate: [F (1,14) = 0.669, p = 0.427; measurement: F (1,14) = 0.190, p = 0.669; interaction: F (1,14) = 2.395, p = 0.144], as can be seen in Figure 3C. Although only anecdotally, Bayesian repeated-measures ANOVA (Supplementary Table S3B) supported the conclusion that the null model (including only participant and random slopes) was the most accurate (BFM = 2.242), with no effect of direction-change rate (BFincl = 0.646), measurement (BFincl = 0.383), or interaction (BFincl = 0.365).
Detrended Fluctuation Analysis
Detrended fluctuation analysis (DFA) can give insights into long-range correlations in non-stationary time series (Peng et al., 1995), which has been applied to postural sway (Duarte and Zatsiorsky, 2001). A computed α exponent value would indicate the ‘smoothness’ of the time-series signals between uncorrelated white noise (α = 0.5) and random-walk Brownian noise (α = 1.5). While α < 1 indicated persistent long-range power-law correlations, α > 1 indicated that long-range correlations do exist but cease to be of a power-law form (Peng et al., 1995).
In Figure 4, the a values for each condition are plotted. Repeated-measures ANOVA (Supplementary Table S4A) revealed significant main effects of measurement [F (1,14) = 213.0, p < 0.001, η2 = 0.345] and direction-change rate [F (2,28) = 29.46, p < 0.001, η2 = 0.416], but no significant interaction [F (1,14) = 2.831, p = 0.076, η2 = 0.003]. Post-hoc comparisons (Supplementary Table S4B) showed significant differences between 0.05 Hz and 0.1 Hz (t = 6.930, p < 0.001, d = 1.563) and between 0.05 Hz and baseline (t = 6.323, p < 0.001, d = 1.426), but not between 0.1 Hz and baseline (t = 0.607, p = 0.549). Bayesian repeated-measures ANOVA (Supplementary Table S4C) supported the best model that comprises both main effects and interactions (BFM = 4.401), though a model without interactions was close (BFM = 3.636). The effects of measurement (BFincl = 2.910 × 10⁷) and direction-change rate (BFincl = 1.041 × 10⁵) were extremely strong, but that of interaction was moderate (BFincl = 3.636). Evidence for the interaction is therefore mixed, but the effect, if any, should be small.
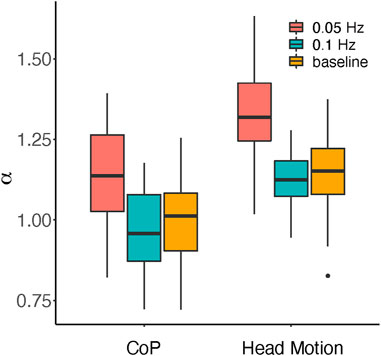
FIGURE 4. The α exponent values for each condition of measurement and direction-change rate.
Head motion was therefore ‘smoother’ than CoP, that is, more like Brownian motion than white noise. This could be because the head position was physically restricted by its previous position, while CoP reflected multiple body segments allowing for more randomness. We should note, however, that the result might also depend on the specific type of testing apparatus.
Discussion
We compared concurrently measured head motion and CoP that were induced by optic flow simulating forward and backward motion of the observer. The head motion and CoP responses were similar except that the signal amplitude was slightly smaller for CoP. Stimulus-dependent peaks were found in the frequency domain for both measurements in a similar way. Long-range correlation properties of signals revealed by a DFA analysis did not show noticeable interactions with other variables, either. We conclude that, at least for the purpose of measuring postural responses to visual motion, there is no crucial difference between head motion and CoP, and thus, head motion can be reliably used as a substitute for CoP.
Head motion is particularly useful when we use a virtual reality HMD, because head position signals can be obtained without extra instruments. Head motion is also advantageous when the participant does not take a standing posture, as head motion can be measured when the individual is sitting (Fujimoto and Ashida, 2020), which is likely when using an HMD at home. Full motion tracking would tell us more in any posture, but its measurement and analysis would be much less convenient.
Our results confirm the usefulness of an inexpensive Wii balance board for measuring CoP (Clark et al., 2011). Although discontinued by the manufacturer, it remains one of the most cost-effective apparatuses for measuring body sway. It is especially convenient when we do not need VR presentation, or when the weight of an HMD is not negligible in the balance of the body (see Imaizumi et al., 2020, on the effect of wearing an HMD; although the effect of weight was not very clear).
The difference in the DFA α could be a caveat for the conclusion. The larger α for head motion suggested faster and more subtle control of balance than is reflected in CoP, and this could depend on conditions. Kobayashi et al. (2005) reported the underestimation of the visual effect in CoP compared to head motion, because vertical motion evoked more displacement of head than trunk. Lubetzky et al. (2022) found a slight reduction in cross-correlation under cognitive load. Anterior-posterior head motion but not CoP increased under the dual-task condition, which was likely due to the tandem positioning of feet that restricted anterior-posterior movement.
Other limitations of our conclusion should be noted. We only examined the anterior-posterior sway induced by forward-backward optic flow. Other conditions such as those involving more intrinsic sway might be different. Also, we only tested relatively slow changes of optic flow (0.05–0.1 Hz) compared to other studies (e.g., 0.125Hz—1 Hz in Chowdhury et al., 2021), because we were particularly interested in vection, which builds up slowly. Differences that we could not capture in our analyses might be important for studies of postural control, especially for clinical applications (see Lubetzky et al., 2022). Tests on different kinds of HMDs and force plates would be necessary. It is, therefore, still an open question as to how head motion and CoP/CoM are related under all conditions. However, our results showing overall similarity can serve as the baseline for further investigations.
Data availability statement
The datasets presented in this study can be found in online repositories. The names of the repository/repositories and accession number(s) can be found below: https://osf.io/xceg6/.
Ethics statement
The studies involving human participants were reviewed and approved by the ethics committee of the Psychological Science Unit, Kyoto University. The participants provided their written informed consent to participate in this study.
Author contributions
Both authors contributed to designing and conducting the experiment, and data analyses. KF wrote programmes for running the experiment. HA prepared the draft of the manuscript, and both contributed to finalising it.
Funding
Supported by JSPS grant-in-aid for scientific research (19K03367 for HA).
Acknowledgments
We thank Duncan Wilson for correcting English writing.
Conflict of interest
The authors declare that the research was conducted in the absence of any commercial or financial relationships that could be construed as a potential conflict of interest.
Publisher’s note
All claims expressed in this article are solely those of the authors and do not necessarily represent those of their affiliated organizations, or those of the publisher, the editors and the reviewers. Any product that may be evaluated in this article, or claim that may be made by its manufacturer, is not guaranteed or endorsed by the publisher.
Supplementary material
The Supplementary Material for this article can be found online at: https://www.frontiersin.org/articles/10.3389/frvir.2022.1026718/full#supplementary-material
References
Audiffren, J., and Contal, E. (2016). Preprocessing the Nintendo Wii board signal to derive more accurate descriptors of statokinesigrams. Seosors 16 (8), 1208. doi:10.3390/s16081208
Bertenthal, B. I., Rose, J. L., and Bai, D. L. (1997). Perception-action coupling in the development of visual control of posture. J. Exp. Psychol. Hum. Percept. Perform. 23 (6), 1631–1643. doi:10.1037/0096-1523.23.6.1631
Chowdhury, N. S., Luu, W., Palmisano, S., Ujike, H., and Kim, J. (2021). Spatial presence depends on ‘coupling’between body sway and visual motion presented on head-mounted displays (HMDs). Appl. Ergon. 92, 103355. doi:10.1016/j.apergo.2021.103355
Clark, R. A., McGough, R., and Paterson, K. (2011). Reliability of an inexpensive and portable dynamic weight bearing asymmetry assessment system incorporating dual Nintendo Wii Balance Boards. Gait Posture 34 (2), 288–291. doi:10.1016/j.gaitpost.2011.04.010
Dichgans, J., and Brandt, T. (1978). “Visual-Vestibular interaction: Effects on selfmotion perception and postural control,” in Handbook of sensory physiology perception. Editors R. Held, H. Leibowitz, and H.-L. Teuber (Berlin: Springer), III, 755–804.
Duarte, M., and Zatsiorsky, V. M. (2001). Long-range correlations in human standing. Phys. Lett. A 283 (1-2), 124–128. doi:10.1016/S0375-9601(01)00188-8
Faul, F., Erdfelder, E., Buchner, A., and Lang, A. G. (2009). Statistical power analyses using G*power 3.1: Tests for correlation and regression analyses. Behav. Res. Methods 41 (4), 1149–1160. doi:10.3758/BRM.41.4.1149
Fujimoto, K., and Ashida, H. (2020). Different head-sway responses to optic flow in sitting and standing with a head-mounted display. Front. Psychol. 11, 577305. doi:10.3389/fpsyg.2020.577305
Fujimoto, K., and Ashida, H. (2019). Larger head displacement to optic flow presented in the lower visual field. Iperception. 10 (6), 204166951988690–17. doi:10.1177/2041669519886903
Horiuchi, K., Imanaka, K., and Ishihara, M. (2021). Postural sway in the moving room scenario: New evidence for functional dissociation between self-motion perception and postural control. Plos one 16 (9), e0257212. doi:10.1371/journal.pone.0257212
Imaizumi, L. F. I., Polastri, P. F., Penedo, T., Vieira, L. H. P., Simieli, L., Navega, F. R. F., et al. (2020). Virtual reality head-mounted goggles increase the body sway of young adults during standing posture. Neurosci. Lett. 737, 135333. doi:10.1016/j.neulet.2020.135333
JASP Team (2022). JASP (version 0.16.3)[computer software]. Available at: https://jasp-stats.org/.
Kim, J., Chung, C. Y., Nakamura, S., Palmisano, S., and Khuu, S. K. (2015). The Oculus Rift: A cost-effective tool for studying visual-vestibular interactions in self-motion perception. Front. Psychol. 6, 248. doi:10.3389/fpsyg.2015.00248
Kobayashi, K., Fushiki, H., Asai, M., and Watanabe, Y. (2005). Head and body sway in response to vertical visual stimulation. Acta Oto-Laryngologica 125 (8), 858–862. doi:10.1080/00016480510031498
Lafond, D., Duarte, M., and Prince, F. (2004). Comparison of three methods to estimate the center of mass during balance assessment. J. Biomechanics 37 (9), 1421–1426. doi:10.1016/S0021-9290(03)00251-3
Lubetzky, A. V., Coker, E., Arie, L., Aharoni, M. M., and Krasovsky, T. (2022). Postural control under cognitive load: Evidence of increased automaticity revealed by center-of-pressure and head kinematics. J. Mot. Behav. 54 (4), 466–479. doi:10.1080/00222895.2021.2013768
Murray, M. P., Seireg, A., and Scholz, R. C. (1967). Center of gravity, center of pressure, and supportive forces during human activities. J. Appl. Physiology 23 (6), 831–838. doi:10.1152/jappl.1967.23.6.831
Palmisano, S., Allison, R. S., Schira, M. M., and Barry, R. J. (2015). Future challenges for vection research: Definitions, functional significance, measures, and neural bases. Front. Psychol. 6, 193. doi:10.3389/fpsyg.2015.00193
Palmisano, S., Apthorp, D., Seno, T., and Stapley, P. J. (2014). Spontaneous postural sway predicts the strength of smooth vection. Exp. Brain Res. 232 (4), 1185–1191. doi:10.1007/s00221-014-3835-y
Palmisano, S., and Riecke, B. E. (2018). The search for instantaneous vection: An oscillating visual prime reduces vection onset latency. PloS one 13 (5), e0195886. doi:10.1371/journal.pone.0195886
Peng, C. K., Havlin, S., Stanley, H. E., and Goldberger, A. L. (1995). Quantification of scaling exponents and crossover phenomena in nonstationary heartbeat time series. Chaos. 5 (1), 82–87. doi:10.1063/1.166141
R Core Team (2021). R: A language and environment for statistical computing. Vienna, Austria: R Foundation for Statistical Computing. Available at: https://www.R-project.org/.
RStudio Team (2022). RStudio: Integrated development environment for R. PBC, Boston, MA: RStudio. Available at: http://www.rstudio.com/.
Saldana, S. J., Marsh, A. P., Rejeski, W. J., Haberl, J. K., Wu, P., Rosenthal, S., et al. (2017). Assessing balance through the use of a low-cost head-mounted display in older adults: A pilot study. Clin. Interv. Aging 12, 1363–1370. doi:10.2147/CIA.S141251
Sugiura, A., Itou, Y., Ota, S., Shimura, M., Tanaka, K., Takada, H., et al. (2015). Effect of unpredictable motion component in video on body sway. Forma 30, 43–50. doi:10.5047/forma.2015.006
van Asten, W. N. J. C., Gielen, C. C. A. M., and Van Der Gon, J. J. (1988). Postural adjustments induced by simulated motion of differently structured environments. Exp. Brain Res. 73 (2), 371–383. doi:10.1007/BF00248230
Wenye, G. (2020). Detrended fluctuation analysis. MATLAB Central File Exchange. Available at: https://www.mathworks.com/matlabcentral/fileexchange/19795-detrended-fluctuation-analysis (Retrieved September 4, 2020).
Keywords: optic flow, postural control, head motion, centre of pressure, HMD, (Min.5-max. 8) 7
Citation: Ashida H and Fujimoto K (2022) Comparing measurements of head motion and centre of pressure for body sway induced by optic flow on a head-mounted display. Front. Virtual Real. 3:1026718. doi: 10.3389/frvir.2022.1026718
Received: 24 August 2022; Accepted: 22 September 2022;
Published: 14 October 2022.
Edited by:
Stephen Palmisano, University of Wollongong, AustraliaReviewed by:
Juno Kim, University of New South Wales, AustraliaFerran Argelaguet, Institut National de Recherche en Informatique et en Automatique (INRIA), France
Copyright © 2022 Ashida and Fujimoto. This is an open-access article distributed under the terms of the Creative Commons Attribution License (CC BY). The use, distribution or reproduction in other forums is permitted, provided the original author(s) and the copyright owner(s) are credited and that the original publication in this journal is cited, in accordance with accepted academic practice. No use, distribution or reproduction is permitted which does not comply with these terms.
*Correspondence: Hiroshi Ashida, ashida@psy.bun.kyoto-u.ac.jp